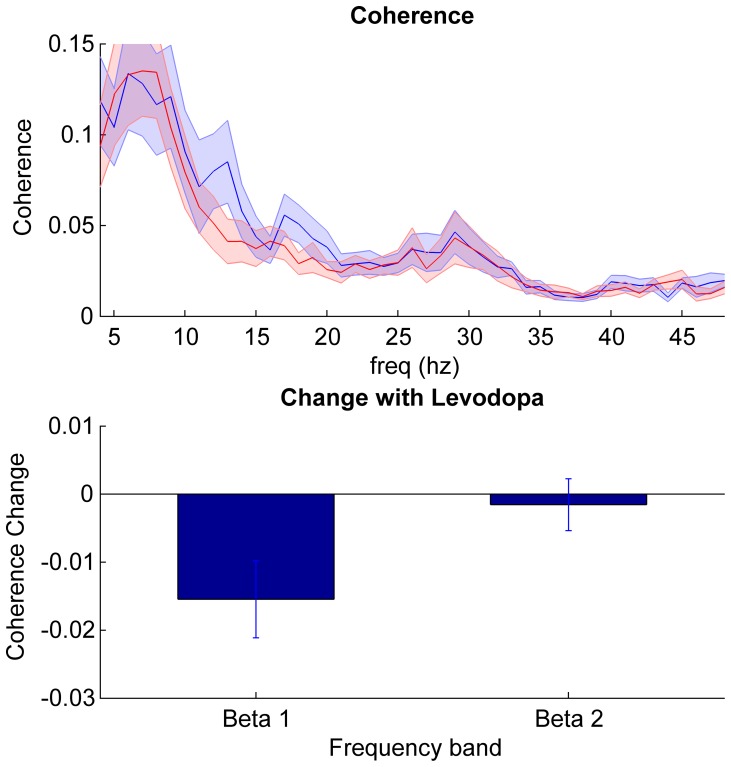
Figure 3. Coherence between STNs.
Top panel shows mean ± SEM coherence of all 23 subjects in the off (blue) and on (red) medication state. Bottom panel shows the mean ± SEM % change between the two states (on –off medication) in the beta sub-bands. Only the coherence suppression in the beta 1 band following levodopa was significant (t22 = −2.7; p = 0.01).

