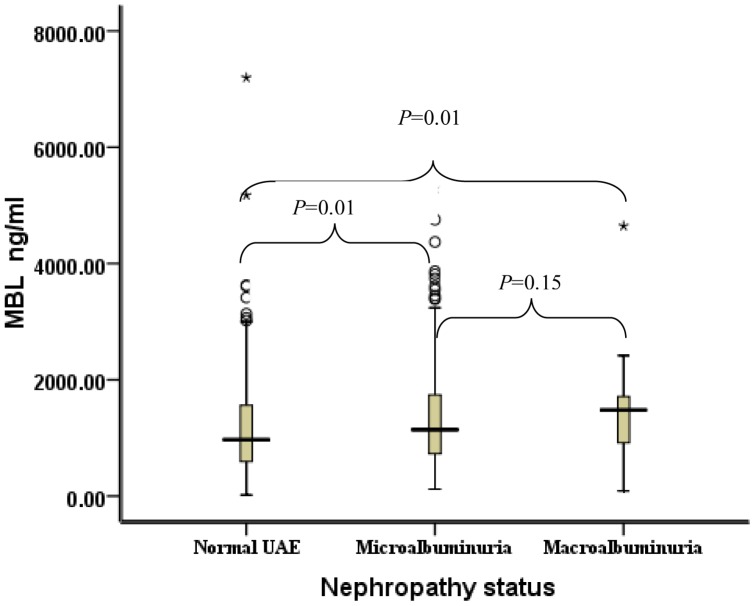
Figure 4. Distribution of serum MBL concentrations for patients stratified by nephropathy status.
Black horizontal lines are median values; □ are interquartile ranges; ○ are outliers; * are extreme values. P values were results of pairwise comparison. The median MBL of patients with normal UAE was 971 ng/m (IQRs: 596–1560), the median MBL of patients with microalbuminuria was 1142 ng/m (IQRs: 728–1739), and the median MBL of patients with macroalbuminuria was 1482 ng/m (IQRs: 917–1713).

