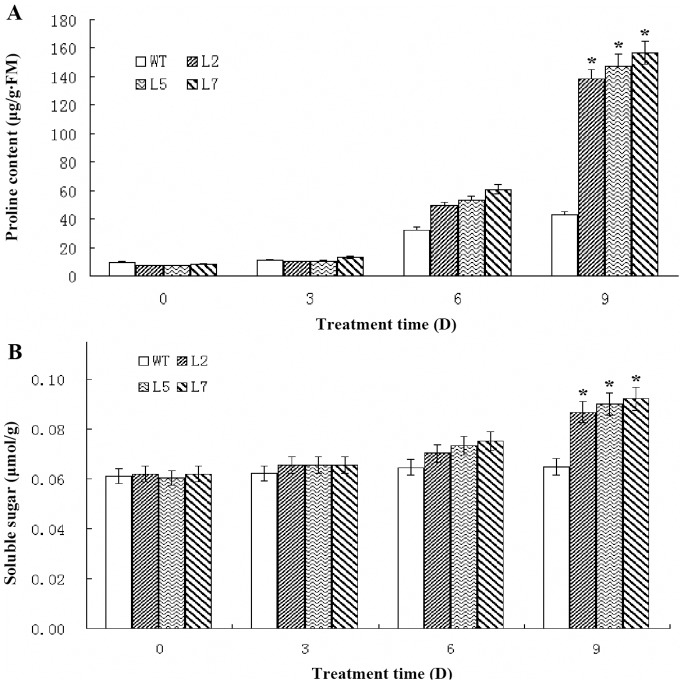
Figure 2. Measurement of soluble sugars and proline content of transgenic and WT plants after treatment with 300.
The WT and transgenic lines (L2, L5 and L7) were grown in pots under normal condition for 4 weeks and then leaves of plants were harvested as controls. Then, the WT and transgenic soybeans were treated with 300 mM NaCl three times with 48 hours interval, while leaves were harvested at 0, 3rd, 6th and 9th days for free proline and soluble sugars content analysis, Data represented the average of three replicates ± SE. *indicated significant difference in comparison to the WT at P<0.05, respectively.

