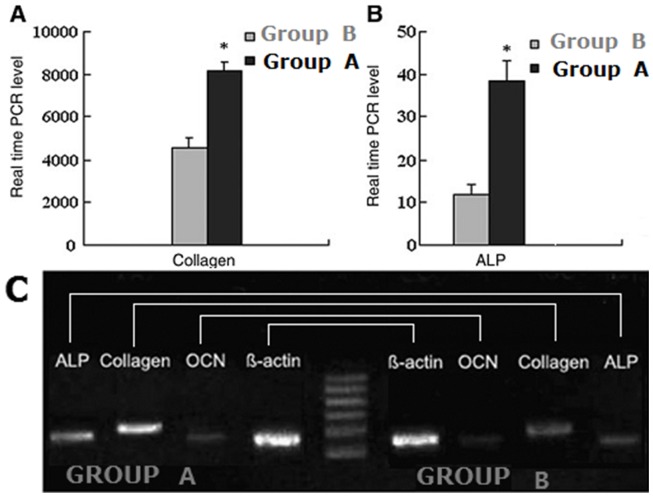
Figure 6. Real-time quantitative PCR and RT-PCR results.
Type I collagen (A) and ALP (B) levels of the BMSCs in the two groups detected on the 14th day using real-time quantitative PCR (n = 6, mean ± SD), *P<0.05; (C) type I collagen, ALP and OCN mRNA levels of the BMSCs in both groups detected on the 14th day using RT-PCR.

