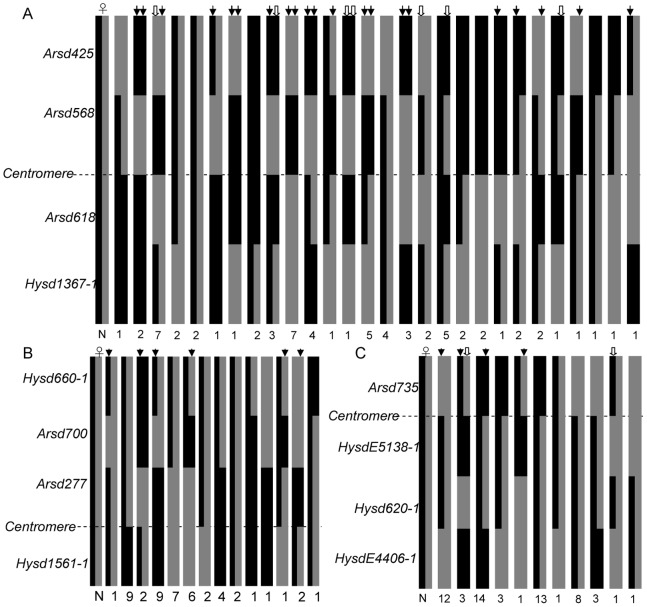
Figure 3. The crossover patterns in chromosomes corresponding to LG16 in family A (A), LG18 in family C (B) and LG12 in family D (C) of bighead carp.
The horizontal dotted lines stand for centromeres in the three LGs. The bars on the left of each figure represent two chromosomes in dams of the three families. Each chromosome segment in gynogens of each family is filled with grey or black color to indicate the genotype at the distal marker; changes in color within a bar represent exchanges between non-sister maternal chromatids. Double crossovers and triple crossovers are labelled by arrows and hollow arrows, respectively. N is the frequency of each four-locus genotype in three gynogenetic families.

