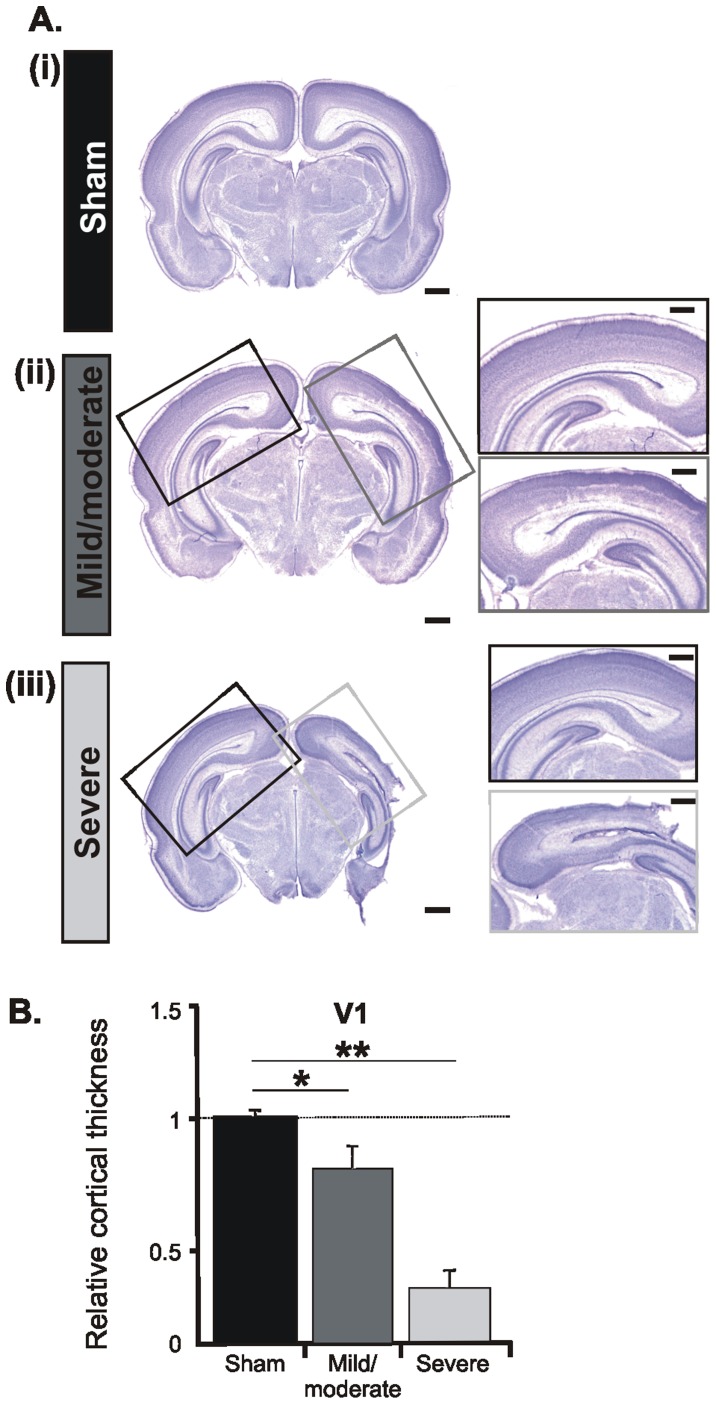
Figure 4. Morphological assessment of the HI injury at the level of V1 post mortem.
(A) Cresyl violet stained coronal sections at the level of the V1 from P8 sham-operated pups (i) as well as pups with mild/moderate (ii) and severe (iii) injury. Sham operation of CCL was performed on the right side. Scale bars correspond to 1 mm. Insets, higher-magnification photographs from the boxed areas displaying the impact of HI on the cortical architecture of the ipsilateral V1 (gray boxes) when compared with the contralateral hemisphere (black boxes). Note the prominent cell loss in the lower layers of the V1 after a HI episode. Scale bars for the insets correspond to 500 µm. (B) Bar diagram displaying the relative cortical thickness of the ligated V1. Values are normalized to the corresponding area in the non-ligated hemisphere and averaged for all 5 sham-operated (black), 5 pups with mild/moderate outcome (dark gray) and 5 severely injured (light gray) P7-8 pups. Data were displayed as mean ± SEM.

