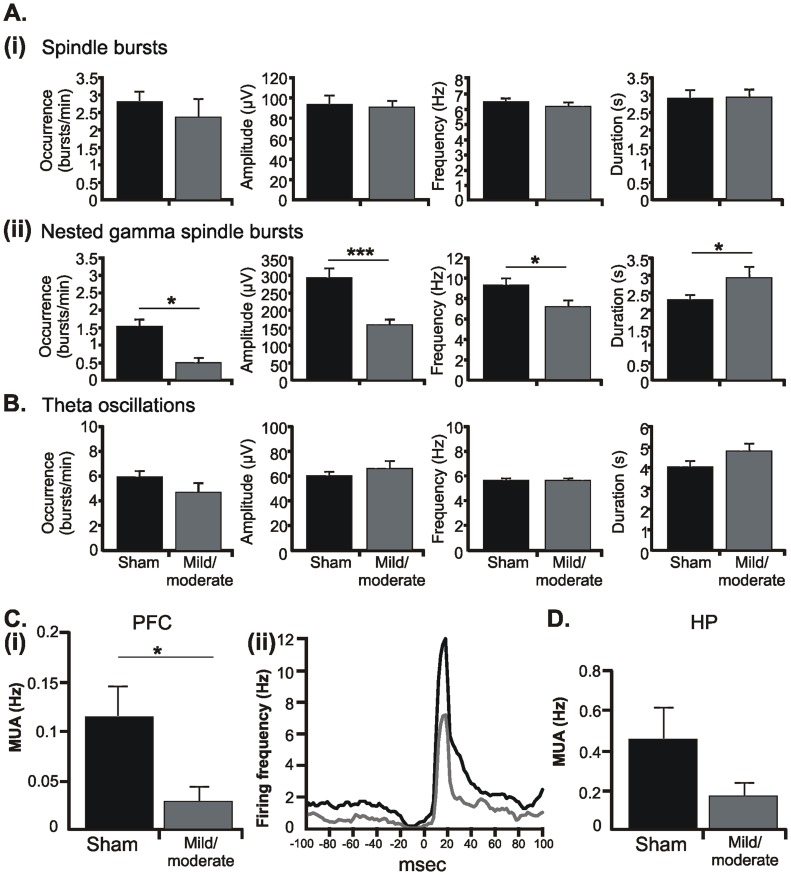
Figure 8. Consequences of HI on the oscillatory network activity and firing of neonatal PL and HP.
(A) Bar diagram displaying the occurrence, amplitude, main frequency, and duration of SB (i) and NG (ii) recorded from the PL of 6 P7-8 sham-operated rats (black) and 6 pups with mild/moderate HI injury (dark gray). Note the selective effect of HI on the NG. (B) Bar diagram displaying the occurrence, amplitude, main frequency, and duration of theta bursts recorded from the CA1 area of the intermediate HP in 6 P7-8 sham-operated rats (black) and 6 pups with mild/moderate HI injury (dark gray). (C) HI-induced changes in the occurrence and temporal distribution of firing in the PL. (i) Bar diagram displaying the firing rate of prelimbic neurons in 7 P7-8 sham-operated pups and 6 rats with mild/moderate outcome. (ii) Representative histogram correlating MUA with the onset (time lag 0 ms) of gamma episodes. Values are averaged from 5 sham-operated pups (black) and 3 pups with mild/moderate injury (dark gray). Note that neurons from both sham-operated and HI-injured pups fire preferentially ∼20 ms after the onset of gamma episodes. (D) Bar diagram displaying the firing rate of CA1 hippocampal neurons in 7 P7-8 sham-operated and 6 HI injured pups. For all diagrams data are displayed as mean ± SEM.

