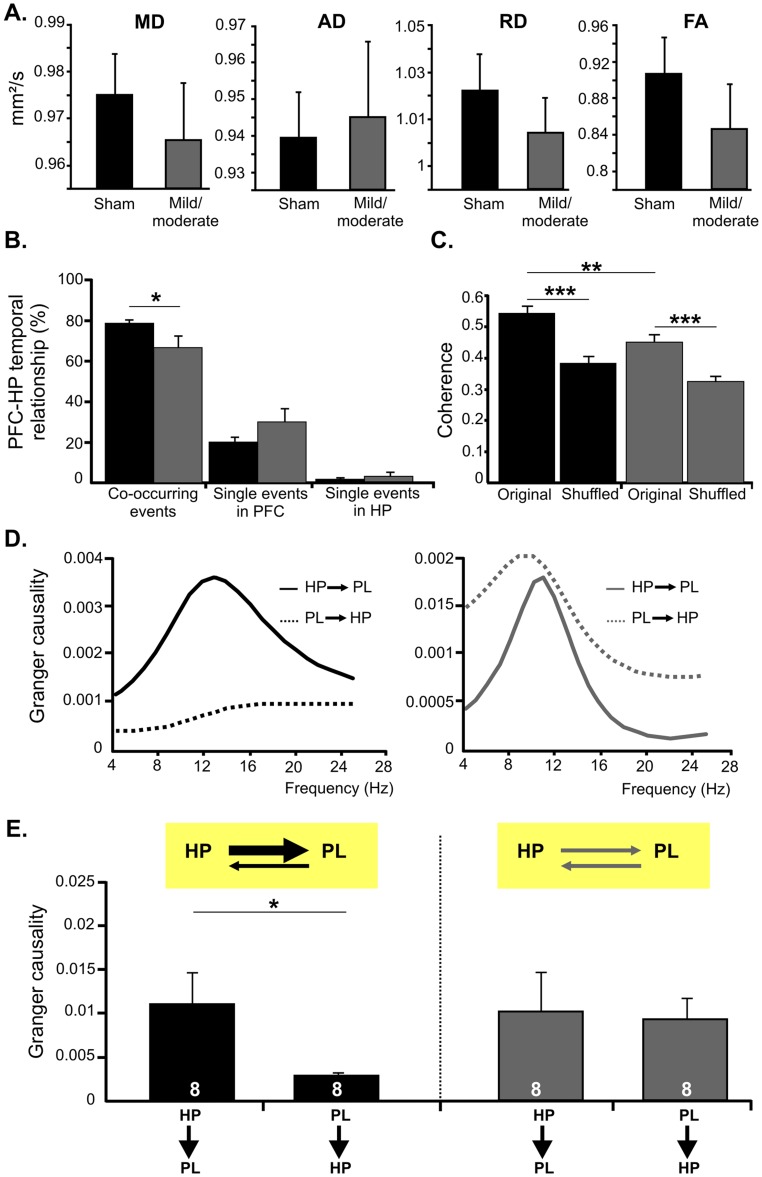
Figure 9. Consequences of HI on the dynamic coupling and directed interactions within neonatal prefrontal-hippocampal networks.
(A) Bar diagrams displaying the ratio of MD, AD, RD and the FA for the left and right hemisphere in sham-operated (black) and HI-injured pups (dark gray). (B) Bar diagram (mean ± SEM) displaying the relative incidence of simultaneously occurring vs. one area-restricted prelimbic oscillations and hippocampal theta bursts recorded from 5 P7-8 sham-operated (black) and 5 pups with mild/moderate injury (dark gray). (C) Coherence of prelimbic-hippocampal oscillations calculated for sham-operated rats (n = 5) and pups with mild/moderate injury (n = 5). Bar diagram (mean ± SEM) reveals the significantly higher prelimbic-hippocampal coherence for original than for shuffled data (oscillatory events in the PL and HP occurring at different time points) in both groups of pups. (D) Examples of Granger causality spectra between the PL and CA1 area of a P7 sham-operated (left) and HI-injured pup (right). (E) Bar diagrams (mean ± SEM) displaying the mean Granger causality averaged over significant (p<0.05) pairs of time segments for the interactions PL-HP at the end of the first postnatal week. The number of investigated pups is marked on bars. Insets, schematic representation of the causal relationship between neonatal prefrontal and hippocampal theta activity under physiological and HI conditions.

