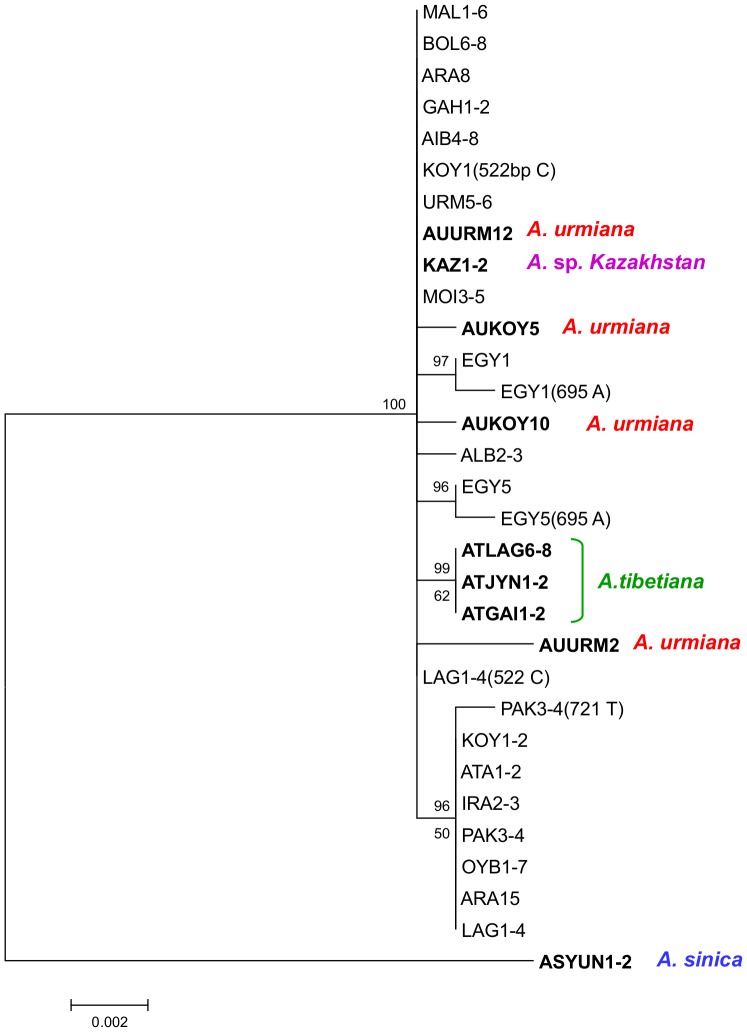
Figure 5. Phylogenetic relationships of diploid parthenogenetic Artemia and Asiatic sexual species based on ITS-1 sequences.
The topology inferred by Maximum Likelihood (ML) method using HKY model is shown. Bayesian (BA) phylogenetic reconstruction showed a very similar topology. The ML bootstrap values higher than 50 are shown below the branch, and the Bayesian support values over 90% are shown above the branch. Haplotypes found in each population are shown, with population codes corresponding to those listed in Table 3. Sequences corresponding to heterozygous individuals are noted with the polymorphic site in parenthesis.

