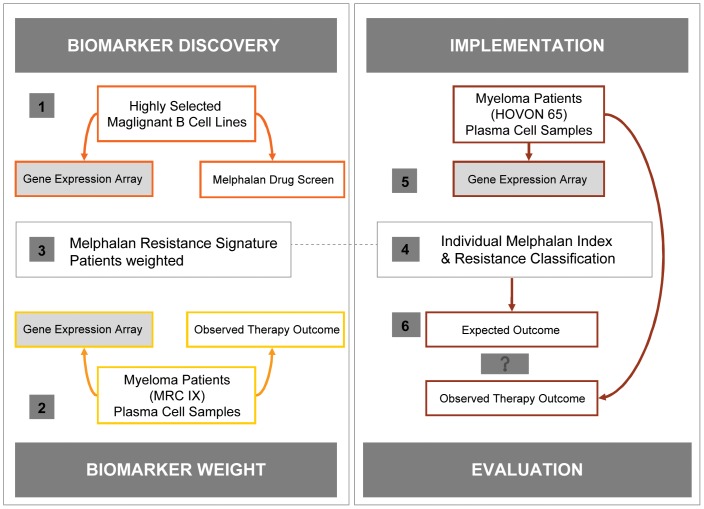
Figure 1. Summary of the stepwise development, adjustment and validation of the resistance gene list.
Numbers relate to step 1–6 as illustrated in the figure. 1) First, The analysis starts by identification of candidate biomarkers by a sparse partial least squares algorithm (SPLS) to build a predictive gene list based on correlations with the GI50 values of the cell line panel, regarded as “biomarker discovery”. 2) Second, the candidate genes were trained to ensure weighted expression in the myeloma data set from the patient cohort in the clinical trial MRC Myeloma IX, to derive a gene signature model, predictive of resistance to melphalan – a step which is regarded as biomarker weighting. The weighting was performed by multivariate Cox regression with PFS as dependent variable and gene expression of the 19 genes as independent variables resulting in a weighted gene signature. 3) The weighted melphalan resistance gene signature is used to define a melphalan RI. 4) The signature is used to classify each tumour from the clinical trial HOVON65/GMMG-HD4 based on the individual GEP data. 5) The RIs were defined to be the linear predictor of the multivariate Cox regression, i.e. calculated for each individual clinical sample by a linear combination of the 19 gene expressions using the weights from the multivariate Cox regression model. 6) Finally, the molecular prediction of resistance to melphalan therapy was compared to the actual observed PFS and OS. – a step regarded as implementation and evaluation.

