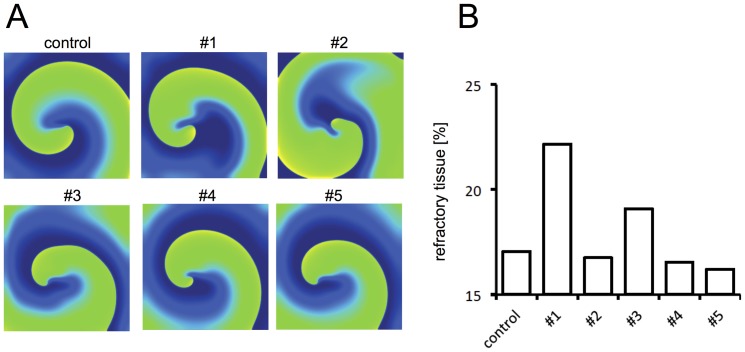
Figure 4. Percent area of refractory tissue.
(A) Spiral wave activity of a single rotor under control cAF conditions and after inhibition with all five test compounds displayed at the end of the 5th second. The transmembrane voltage is color-coded with blue representing −80 mV and yellow representing 0 mV. (B) Summarized data of the mean percentage of refractory tissue quantified over the last 4 seconds of inhibition (control: 17.2%, #1: 22.2%, #2: 16.8%, #3: 19.1%, #4: 16.6%, #5: 16.2%).

