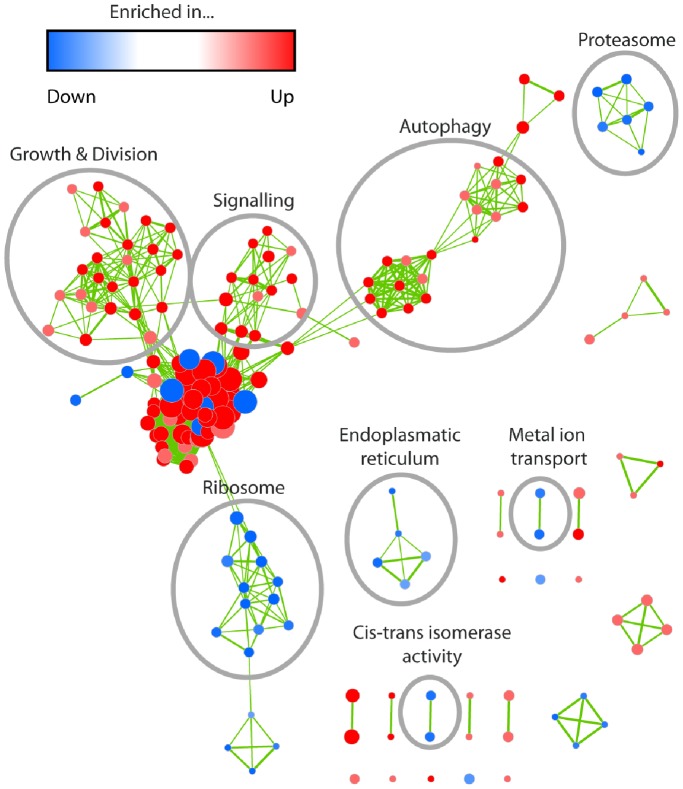
Figure 4. GO term enrichment map for the library of down- and up-regulated genes.
Each node represents one GO term. The thickness of the edges represents the number of genes shared by two terms. The node color corresponds to the group and the degree of significance for enrichment (see color bar). Node sizes indicate the number of genes within the corresponding GO term. GO terms are grouped by their similarity degree defined by the number of common genes or related terminology. Striking groups were manually circled and labelled. Map regions with a high density of thick-sized nodes (center of figure) represent GO terms, describing very general processes with rather low information.

