
Figure 3. Vorticity field analysis.
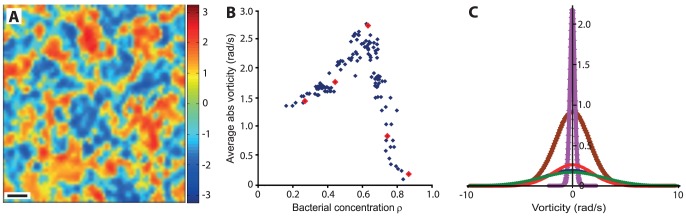
(A) The vorticity field at ρ = 0.67. Colors indicate the z-component (the magnitude) of the curl of the velocity field - the "strength" of the vorticity. Values on the bar are in rad/s. Negative values (blue) means clock-wise motion and positive values (red) means counter clock-wise motion. Scale bar equals 10 µm. (B) The average absolute value of vorticity as a function of bacterial concentration ρ. The red large dots represent the 5 different concentrations discussed in (C). (C) Probability density histogram for 5 different bacterial concentrations ρ = 0.28 red, 0.46 blue, 0.67 green, 0.74 brown and 0.87 pink; the y-axis is normalized so that the area below each curve equals 1. All speed distributions are well approximated by a Normal distribution.