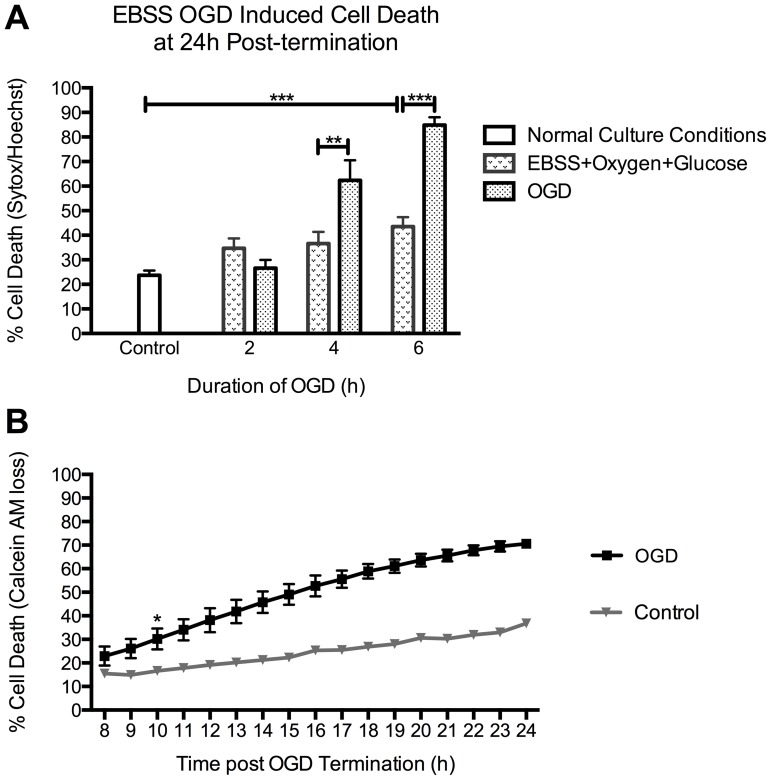
Figure 1. OGD-induced cell death in rat cortical neurons.
A. OGD caused an increase in neuronal cell death levels, analysed by sytox/hoechst imaging, which correlated with increased durations of OGD. Basal levels of cell death within our cultures, under normal culture conditions, were determined as 23.7±2% (n = 3). Neurons were placed in EBSS with or without oxygen and glucose. Cells with EBSS plus oxygen and glucose (EBSS+Oxygen+Glucose) only demonstrated a significant increase in levels of death, in comparison to controls, following 6 h of exposure. 2 h of OGD did not increase cell death levels above those in EBSS+Oxygen+Glucose controls. However, 4 and 6 h of OGD increased cell death levels significantly to 62.4±8.2% (p = 0.026, n = 5) and 84.9±3.2% (p<0.0001, n = 5) respectively, compared to EBSS+Oxygen+Glucose controls. B. Cell death induced by 4 h of OGD becomes apparent between 8 and 24 h post-OGD termination. Analysis of the time course of OGD-induced cell death using Calcein AM time-lapse assay. Time-lapse imaging of Calcein AM stained cells indicated that OGD-induced cell death became apparent at 8 h and reached maximum levels at 24 h post-OGD termination. Levels of cell death became significantly higher than controls at 10 h post- OGD termination, indicated by *, where cell death levels were 18.7±2.4% and 39.7±6.4% for control and OGD, respectively (p = 0.045, n = 3). Neuronal cell death levels, following OGD reach 75±2% at 24 h post-OGD termination. Data represent mean ± SEM.

