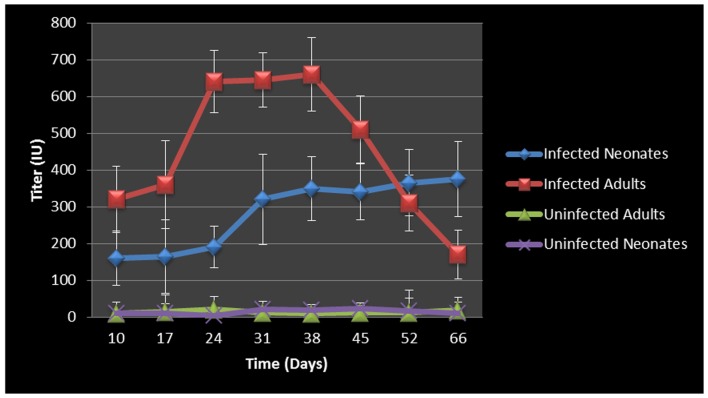
Figure 2. Chlamydia antibody titers over time.
Antibody titer graph shows strong antibody responses to Chlamydia from infected adult mice but relatively decreased and/or retarded antibody titers in the infected neonatal mouse groups. Infected adult titers dropped once infections cleared, however infected neonatal mice did not clear the infection and their titers consistently increased over the course of the study. Each point on the graph represents the average serum titer from at least 8 animals, with sera run in duplicate. The error bars represent the standard error of the mean within each group at the specific time point.

