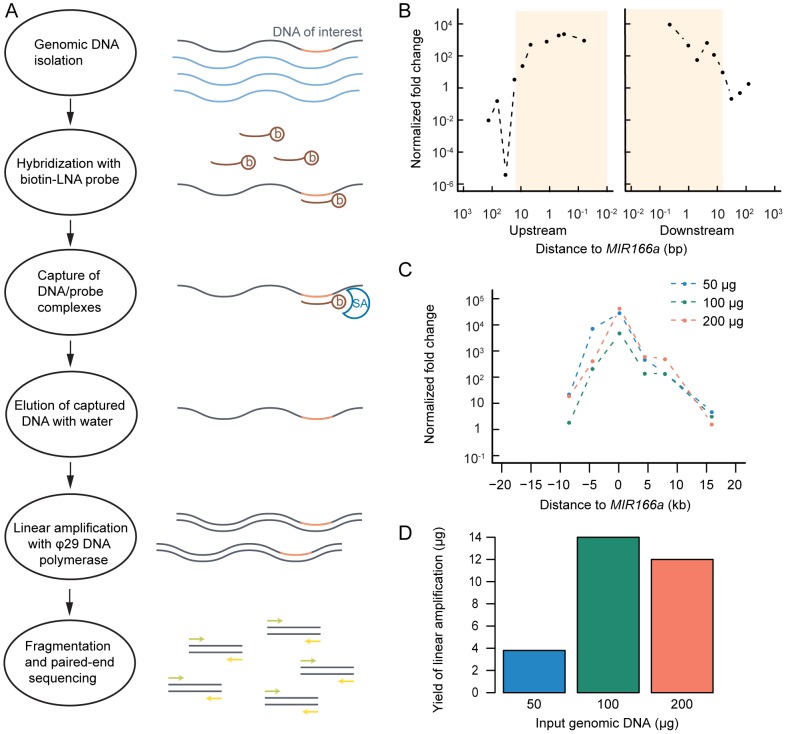
Figure 1. Pilot targeted enrichment experiment in Arabidopsis shows enrichment near a targeted locus.
(A) Schematic overview of targeted genome enrichment method. b: Biotin, SA: Streptavidin. (B) Quantitative real-time PCR (qPCR) of enriched DNA with designed primers surrounding the MIR166a locus. Normalized fold change relative to Act1 (as a control) after enrichment is shown. Shaded box indicates the region with a normalized fold change above one. (C) Amount of input genomic DNA (gDNA) does not affect the fold of the enrichment. Normalized fold change relative to Act1 after enrichment is shown with varying amount of gDNA. (D) Amount of gDNA affects the yield of the enrichment. Yield after enrichment is shown, as is measured by Qubit® Fluorometer.

