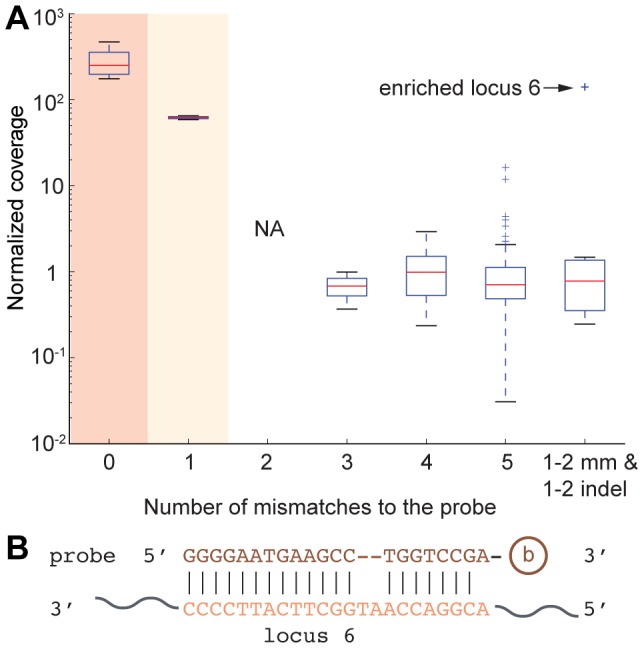
Figure 5. Enrichment is highly specific for loci with zero or one mismatch.

(A) Box plot shows normalized coverage of loci with different mismatches to the probe. Last box shows genomic loci which are similar to locus 6, with one or two mismatches and one or two insertions and deletions in the alignment to the probe. “+” symbols represent outliers that are outside 1.5 IQR (inner quartile range). Dark shade denotes p<0.01 with Student's t test against a normalized coverage of one. Light shade denotes p<0.05. (B) Sequence alignment between capture probe and enriched locus 6.
