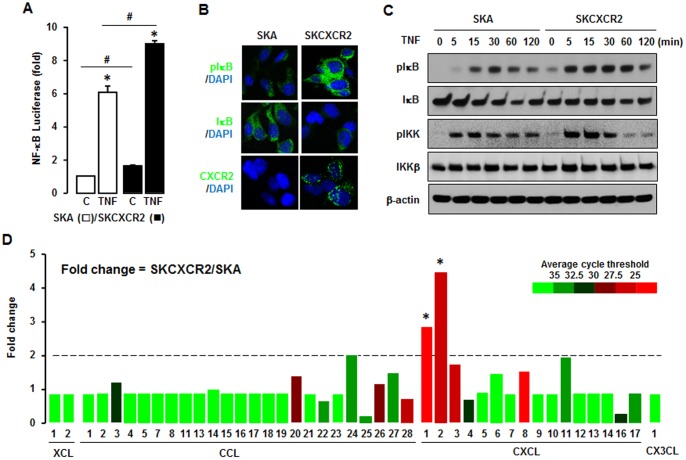
Figure 2. CXCR2 expressing cells have a higher activation of NF-κB in both basal and TNF-stimulated levels and increase CXCL1/2.
(A) Effect of TNF on NF-κB luciferase activities in SKA and SKCXCR2 cells. After transfection using NF-κB luciferase vector overnight, cells were treated with TNF (10 ng/ml) for 4 h. Experiments were performed in triplicate and data are shown as mean ± S.E. * and # (p≤0.05) when compared to Control and SKA cells, respectively, by the paired Student’s t-test. (B) Representative immunofluorescent staining of SKA and SKCXCR2 cells indicating IκB activation and CXCR2 protein expression levels (in green). (C) Effect of TNF (10 ng/ml) over time (0–120 min) on NF-κB activation in SKA and SKCXCR2 cells. Whole cell lysates were prepared and Western blots carried out using antibodies specific to IκB and IKK as well as their phosphorylated forms (pIκB and pIKK). β-actin was used as a loading control. (D) Chemokine profile comparisons in SKCXCR2 relative to SKA cells. After isolating total RNA, a human chemokine PCR array was performed. The dotted line indicates a 2-fold increase; those with a >2-fold increase and average cycle threshold <30 are recognized as induced chemokines, and in this case represent CXCL1 and 2 (*).

