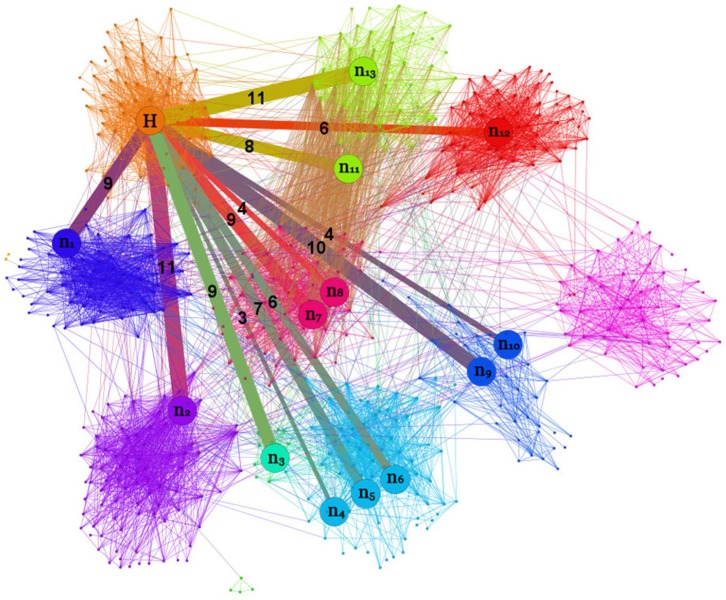
Figure 9. Visualizing the community structure and a bridge hub in the Caltech network.
The Caltech network can be divided into 13 communities based on the method of Newman and Girvan [55], as illustrated by the different colors. Also illustrated is a bridge hub  that carries the largest number of weak ties and connects with other bridge nodes labeled as
  to
to  . The number on a weak tie shows the difference in the numbers of weak ties originated from the node
  and the bridge node at the other end of the weak tie.

