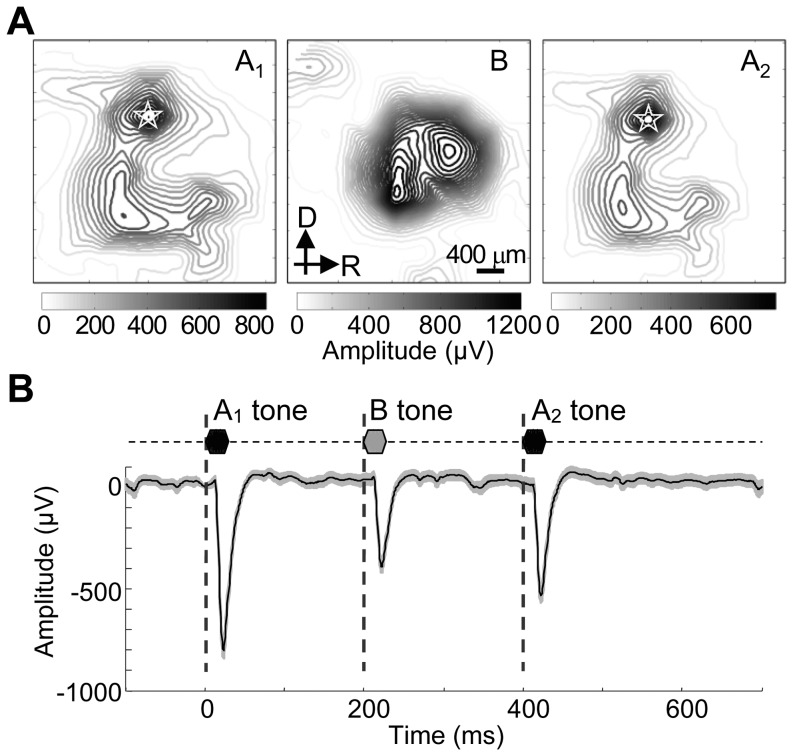
Figure 4. Representative LFP evoked by ABA triplet.
A. Cortical mapping of evoked LFP maxima to A1, B and A2 tones. The test ΔF was 12 semitones, and ITI was 200 ms. A white star indicates the local focus of A tone-evoked response in the primary auditory cortex. B. Evoked LFPs to a triplet of an ABA- sequence at the local focus of A tone-evoked response. A representative grand average across trials and s.d. are given.

