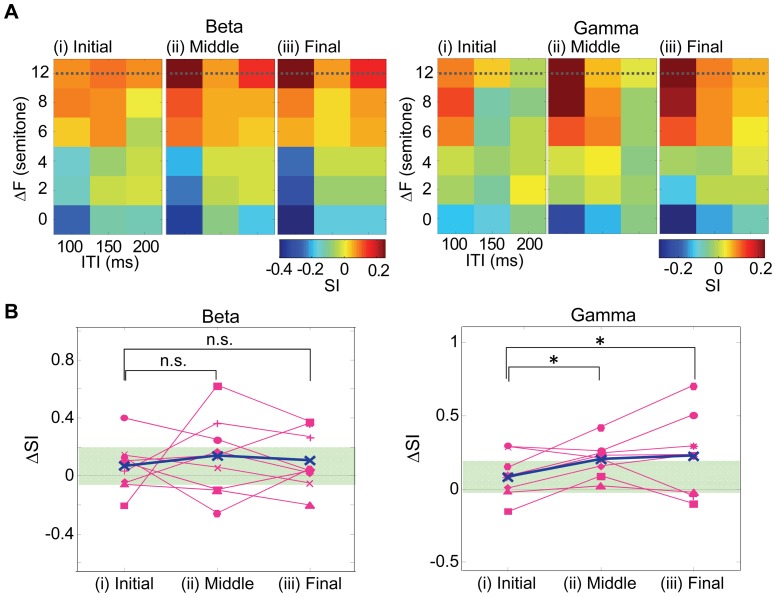
Figure 9. Temporal evolution of beta- and gamma-band ITPC to A2 tone.
A. SI distributions in the ITI–ΔF plane: left panel, beta band; right panel, gamma band. SIs were quantified in the initial (i), middle (ii), and final thirds (iii) of the tone sequence. B. ΔSI (i.e., an increment from SI at 200 ms ITI to SI at 100 ms ITI) at 12 semitones of ΔF (dotted line in A) in the initial, middle and final thirds of tone sequences. Data from individual animals are shown. Bold line denotes the average ΔSI across subjects. Asterisks indicate statistical significance of ΔSI between the initial period and the other periods at 12 semitones of ΔF (p<0.05). Shaded areas correspond to 95% confidence interval of ΔSI distribution during the initial period.

