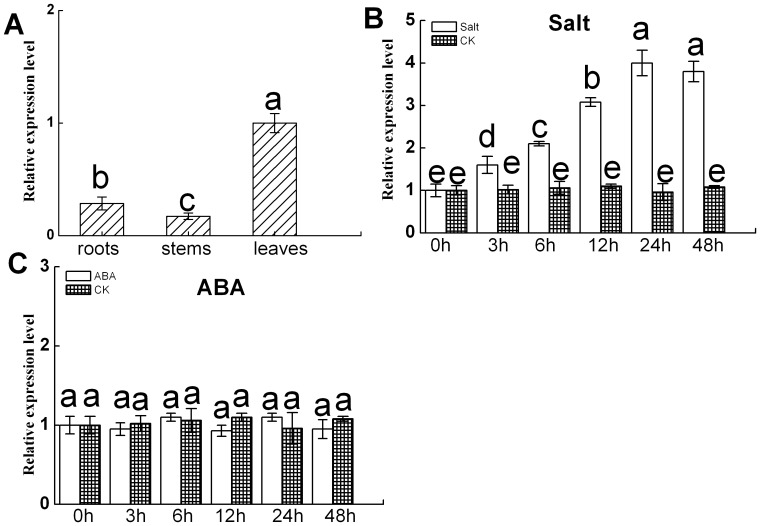
Figure 4. Quantitative real-time PCR analysis of expression patterns of DgNHX1 in different organs and in response to salt and ABA treatments.
The relative expression of DgNHX1 in untreated leaves was used as CK. (A) Expression patterns of DgNHX1 in roots, stems, and leaves. (B) Salt. (C) ABA. Data represent means and standard errors of three replicates. Different letters above columns indicate (P<0.05) differences between treatments.

