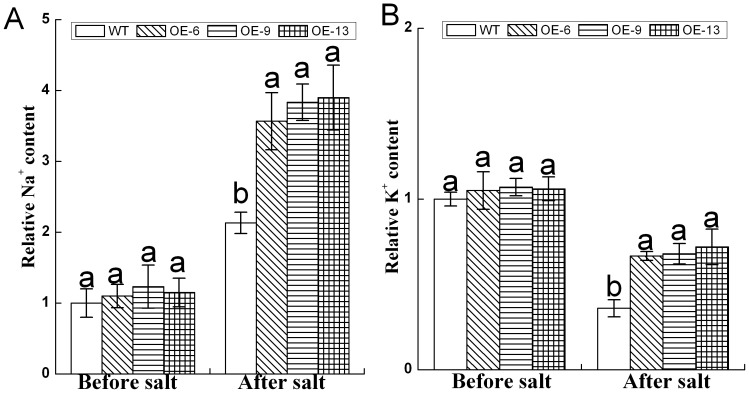
Figure 7. Na+ (A) and K+ (B) contents in leaves of WT and transgenic T2 lines (OE-6, OE-9, and OE-13) under normal conditions or after 4 days salt treatment, respectively.
Data represent means and standard errors of three replicates. Different letters above columns indicate (P<0.05) significant differences according to Duncan's multiple range test between lines.

