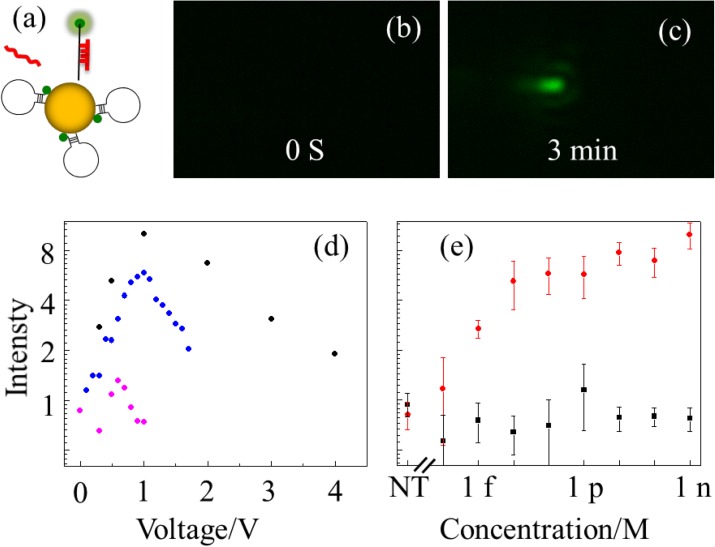
Figure 2.
(a) Schematics of designed hairpin probe on gold particle. (b) Before packing gold particles, probe fluorescence signal was too weak to be detect. (c) After packing for 3 minutes, a strong fluorescence signal appears at the NP aggregate. (d) Normalized intensity (average of all pixels above a threshold (15 au) normalized with respect to the average over all pixels (with 0-250 au)) as a function of packing voltage for different samples. Black, 1 nM target ; blue, 10 pM target; purple, 10 nM 2-mismatch non-target. (e) Intensity dependence on target concentration. Measured normalized intensity before packing (black) and after packing (red), for three independent experiments with different nano-capillaries at each concentration. NT stands for non-target at 10 nM as a reference.

