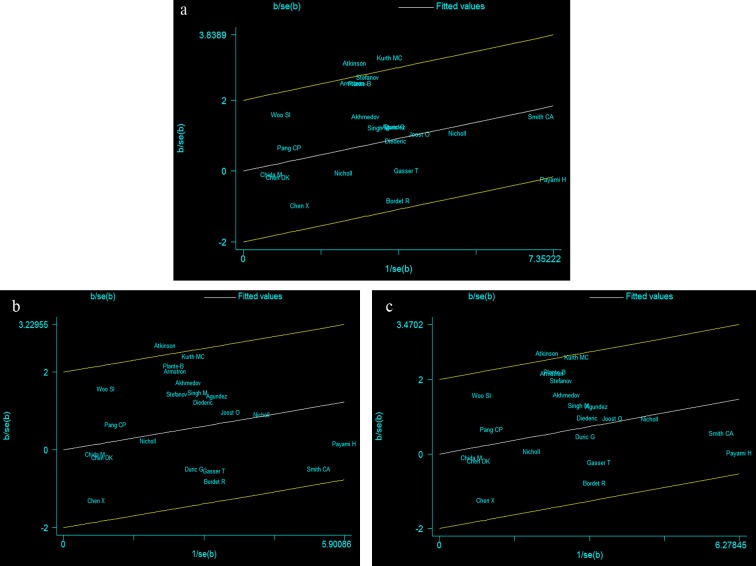
Figure 2. Galbraith plots of CYP2D6*4 allele polymorphisms and PD risk in different contrast models.
a The studies of Kurth MC et al. and Atkinson A et al. were outliers in the contrast A vs. G. b The studiy of Atkinson A et al. was the outlier in the contrast AG vs. GG. c The studies of Atkinson A et al. was the outlier in the contrast AG+AA vs. GG.

