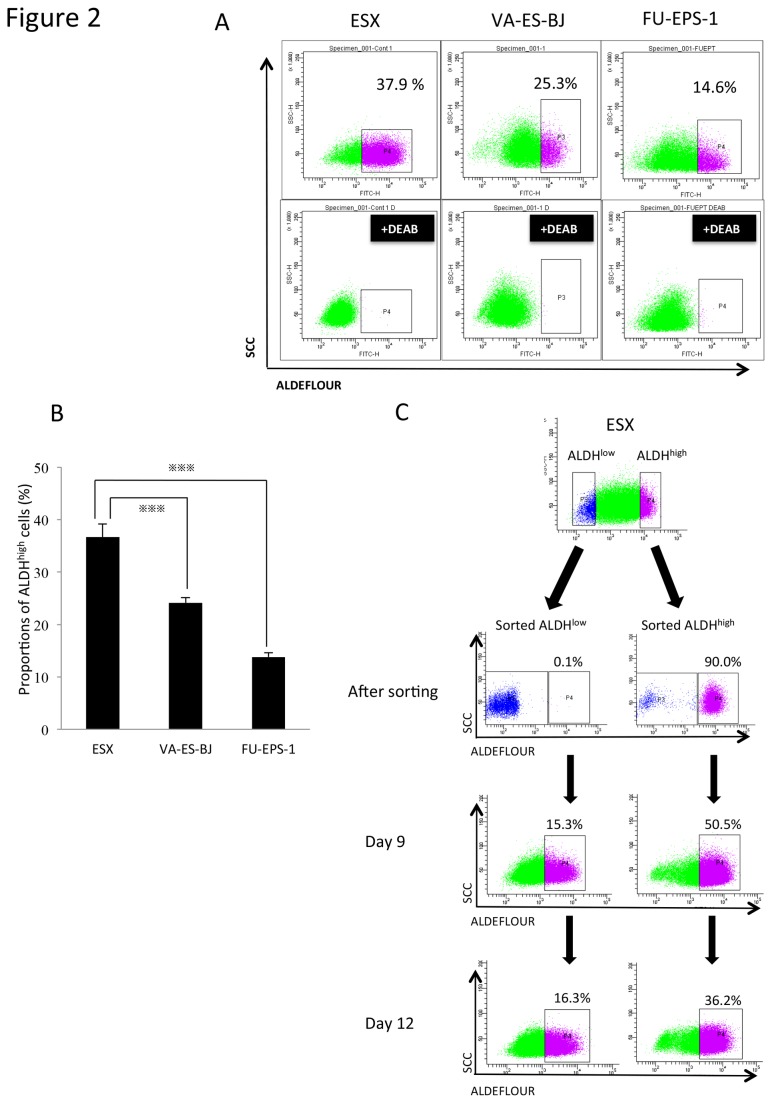
Figure 2. Identification of an ALDHhigh population in ES cell lines.
A. All 3 ES cell lines, ESX, VA-ES-BJ and FU-EPS-1, demonstrated ALDH activity. FACS analysis of ALDH1 expression in cells and the DEAB control.
B. The proportions of ALDHhigh cells in ESX, VA-ES-BJ and FU-EPS-1. Bars represent mean±SEM (n=4) of multiple experiments. ※※※ p<0.001, determined by the Mann-Whitney test.
C. Differentiation of ALDHhigh and ALDHlow cells in vitro. Sorted ALDHhigh and ALDHlow cells were analyzed on days 0 (immediately after sorting), 9 and 12. Representative fluorescence-activated cell sorting analysis is shown.

