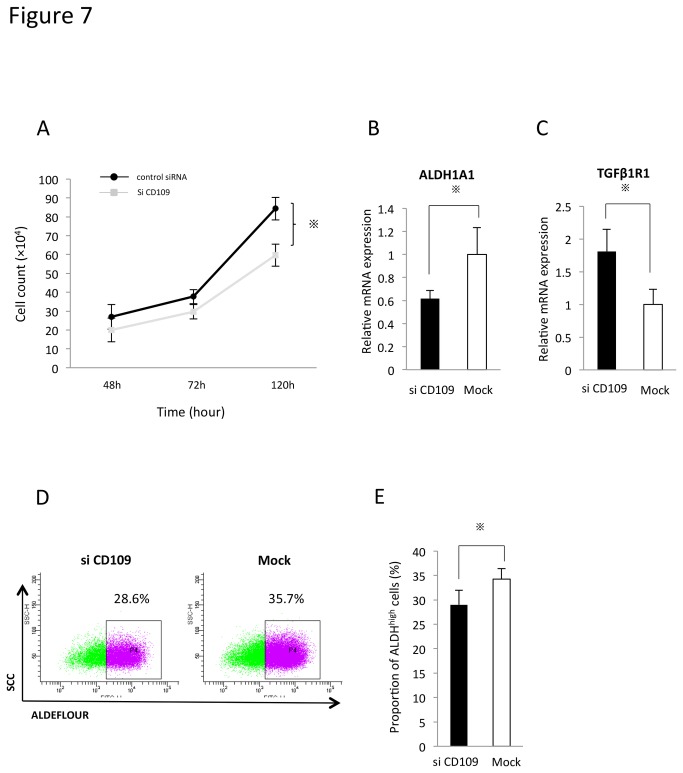
Figure 7. CD109 positively regulates ALDH activity and negatively regulates the TGFβ/Smad signaling pathway.
A. The cell proliferation curve of ESX treated with SiCD109 or control siRNA. Bars represent mean±SEM (n=4). ※ p<0.05, determined by the Mann-Whitney test.
B, C. mRNA expression of ALDH1A1 (D) and TGFβ1R1 (E). The expression of ALDH1A1 and TGFβ1R1 was evaluated by real-time PCR two days after transfection.
D. FACS analysis of ALDH activity.
E. The proportion of ALDHhigh cells. Bars represent mean±SEM (n=4). ※ p<0.05, determined by the Mann-Whitney test.

