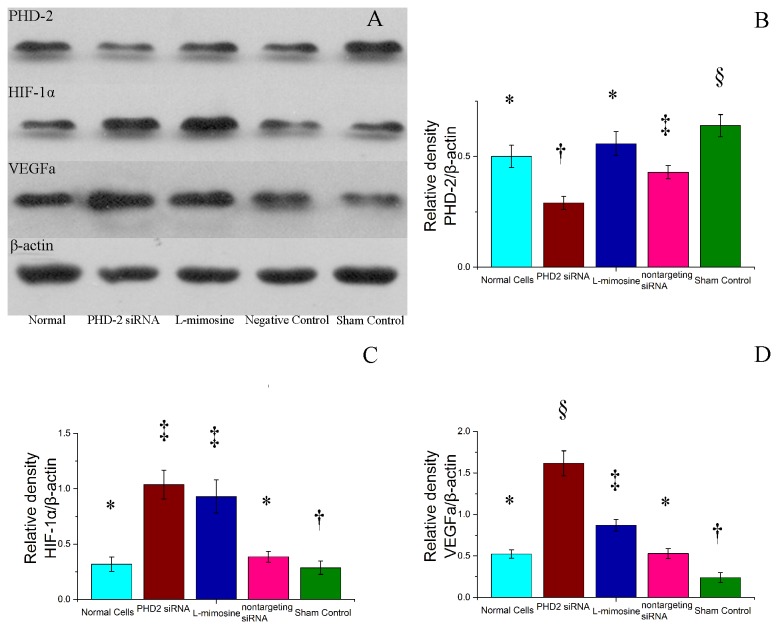
Figure 6. Assessment of the expression of Prolyl hydroxylase domain 2 (PHD-2), Hypoxia inducible factor 1α (HIF-1α), vascular endothelial growth factor a (VEGFa) in vivo.
A: gross images of western blot results. B: Quantified PHD2 expression relative to β-actin. C: Quantified HIF-1α expression relative to β-actin. D: Quantified VEGFa expression relative to β-actin . siRNA, small interferingRNA. Symbols (*,†, ‡, §) indicated significant difference (at .05 level) by Tukey multiple comparison procedure. * vs. other groups, p≤0.05. There is no significant difference between groups labeled with same symbol.

