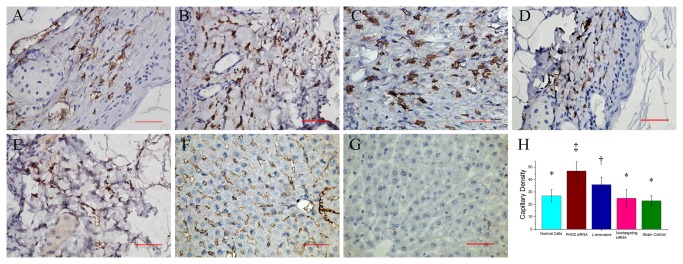
Figure 7. Representative images of immunohistochemistry stain by CD31 (400×magnification).

A: Wound tissue in group 1 (implanted with untreated fibroblasts). B: Wound tissue in group 2 (implanted with fibroblasts treated by PHD2 siRNA), showing blood vessels stained by CD31 with higher density. C: Wound tissue in group 3 (implanted with L-mimisine treated fibroblasts). D: Wound tissue in group 4 (implanted with negative control fibroblasts). E: Wound tissue in group 5 (without cell implantation), showing low density of blood vessel with small diameter. F: CD31 immunohistochemistry stain for murine liver tissue, served as positive control. G: negative control of CD31 immunohistochemistry stain. H: Comparison of microvessel density among different groups. Symbols (*,†, ‡) indicated significant difference (at .05 level) by Tukey multiple comparison procedure. * vs. †, * vs. ‡ , † vs. ‡, p≤0.05. There is no significant difference between groups labeled with same symbol. The scale bars in right lower corner represent 50 μm.
