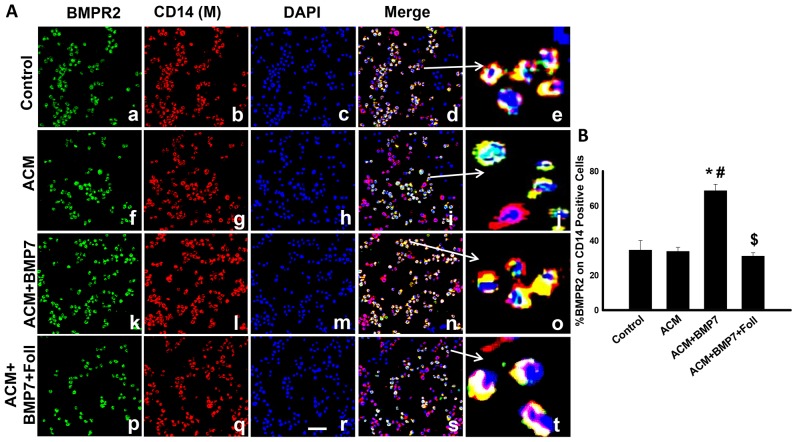
Figure 1. Treatment with BMP-7 increases expression of BMPR2 on monocytes.
Left panel A shows representative photomicrographs of anti-BMPR2 in green (a, f, k, p), anti-CD14 in red (b, g, l, q), DAPI in blue (c, h, m, r), merged images (d, i, n, s) and enlarged merged images (e, j, o, t). Scale bar = 50 µm. Right histogram B shows quantitative analysis of CD14 positive cells expressing BMPR2 with a significant increase in the ACM+BMP7 group compared to Control, ACM and ACM+BMP7+Foll groups. *p<0.05 vs Control, #p<0.05 vs ACM, $p<0.05 vs ACM+BMP7, n = 6.

