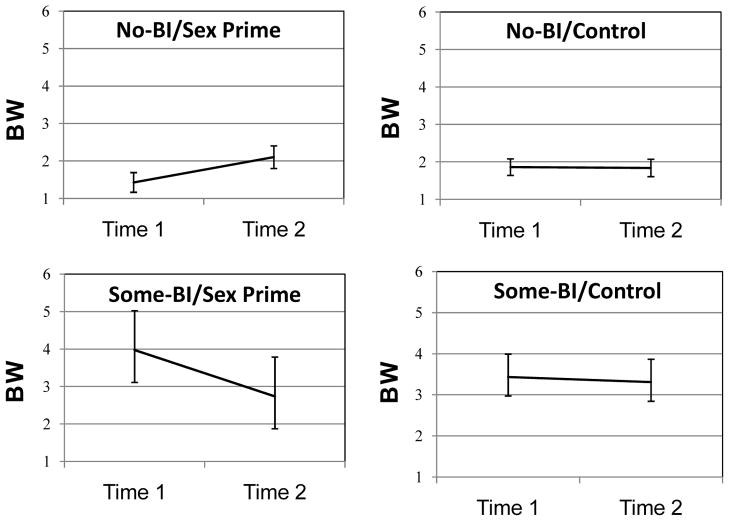
Figure 2.
Estimated marginal means of BW at T1 and T2 for each cell. Change in BW was only significant in the No-BI/Sex Prime group (top left, n = 40); Change was not significant in the No-BI/Control (n = 41), Some-BI/Sex Prime (n = 13), and Some-BI/Control (n = 18). Error bars indicate +/− 1 standard error. N = 112.

