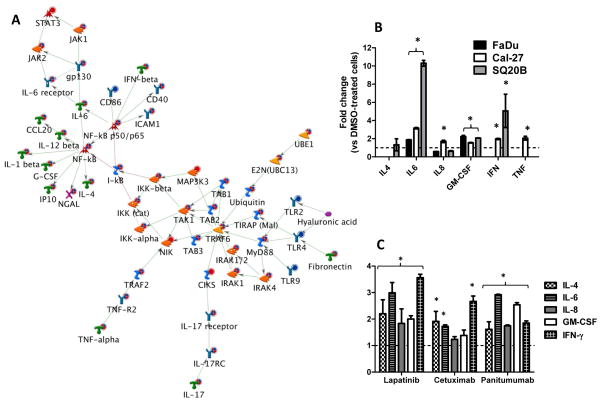
Figure 1.
Pro-inflammatory cytokines are induced by EGFR inhibitors in HNSCC cells. A: Shown is the most significant (p = 7.27×10⁻²¹) network constructed from differentially regulated transcripts comparing microarray data from erlotinib (5 μM, 48 h) treated FaDu, Cal-27 and SQ20B head and neck squamous carcinoma (HNSCC) cells versus DMSO treated HNSCC cells. The microarray expression value changes were uploaded to and analyzed by MetaCore™ (GeneGo) software. Up regulated genes are marked with red circles; down regulated with blue circles. The ‘checkerboard’ color indicates mixed expression for the gene between cell lines. B: FaDu, Cal-27 and SQ20B cells were treated with 5 μM erlotinib (ERL) or DMSO for 48 h and then analyzed for proinflammatory cytokine production using an 8-plex human cytokine panel. SQ20B cells were treated with lapatinib (LAP, 5 μM), cetuximab (CET, 100 μg/ml) and panitumumab (VEC, 100 nM) for 48 h before analysis for proinflammatory cytokine production using an 8-plex cytokine panel (C). ERL and LAP-induced changes were compared to DMSO controls; CET and VEC-induced changes were compared to IgG controls. All controls were set at a value of 1 (hatched line). Error bars represent ± standard error of the mean (SEM) of N = 3 experiments. *:p<0.05 versus DMSO or IgG control.

