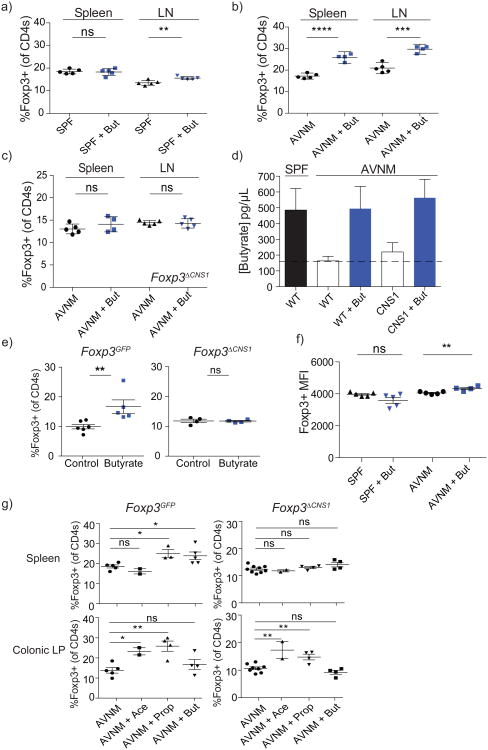
Figure 2. Butyrate provision promotes extrathymic Treg cell generation in vivo.
a, b) Flow cytometric analysis of Foxp3+ Treg cell subsets in the spleen and lymph nodes (LN) of AVNM-treated (AVNM) or untreated (SPF) B6 or Foxp3GFP mice treated with (+But; blue symbols) or without (black symbols) butyrate in drinking water. Data are representative of 3 independent experiments.
c) CNS1-deficient mice were treated with AVNM with or without butyrate as in (a) and analyzed for Foxp3 expression in splenic and lymph node (LN) CD4+ T cell populations. Data are representative of 2 independent experiments.
d) LC-MS analysis of butyrate in serum from CNS1-sufficient B6 (WT) and -deficient mice (CNS1) treated as in (a). Serum was derivatized with 2-nitrophenylhydrazine-HCl. Butyrate levels in serum of untreated (SPF) B6 mice are shown in black. Antibiotic-treated (AVNM) WT and CNS1-deficient animals supplemented with (+But; solid bars) or without (empty bars) butyrate are shown. At least 4 mice per group; error bars denote SEM.
e) Flow cytometric analysis of Foxp3+ Treg cell populations in colonic lamina propria of Foxp3GFP (left) and CNS1-deficient mice(right). Mice were administered butyrate (blue symbols) or pH-matched water (control; black symbols) by enema for 7 days and analyzed for Foxp3 expression in colonic CD4+ T cell populations. The data represent the combination of 2 independent experiments; error bars denote SEM.
f) Flow cytometric analysis of Foxp3 protein expression on a per cell basis in splenic Foxp3+ Treg cells in B6 mice treated with butyrate (+But) alone (SPF) or in combination with antibiotics (AVNM) as indicated. The data are shown as mean fluorescence intensity (MFI) +/- SD. Data are representative of at least 3 independent experiments.
g) AVNM-treated Foxp3GFP (left) and CNS1-deficient mice (right) were administered acetate (Ace), propionate (Prop), butyrate (But), or no SCFA (AVNM) for a period of 3 weeks followed by analysis of Foxp3+ Treg cell subsets within CD4+ cells isolated from the colonic lamina propria (top panels) or spleens (bottom panels). Data represent the combination of 2 independent experiments; error bars denote SEM.
* P ≤ 0.05, ** P ≤ 0.01, *** P ≤ 0.001, **** P ≤ 0.0001 as determined by Student's t-test.

