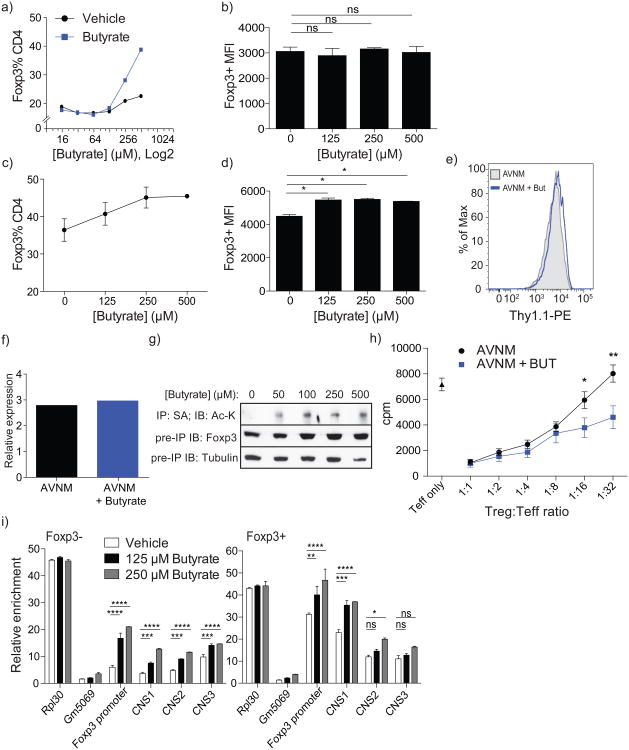
Figure 3. Butyrate acts within T cells to enhance acetylation of the Foxp3 locus and Foxp3 protein.
a) Induction of Foxp3 expression upon stimulation of naïve CD4+ T cells by CD3 antibody in the presence of butyrate-treated or untreated Flt3L-elicited DC and TGF-β. DC were cultured with titrated amounts of butyrate or medium alone for 6 h, washed and co-cultured with FACS-purified naïve CD4+ T cells in the presence of CD3 antibody and TGF-β. The data are shown as percent CD4+ cells expressing Foxp3 after 4 days of culture. Data are representative of at least 4 independent experiments.
b) Analysis of Foxp3 protein expression on a per-cell basis in Treg cells generated in the presence of butyrate pre-treated Flt3L-elicited DC [as in (a)]. The data are shown as mean fluorescence intensity (MFI); error bars denote SEM.
c) Percent of CD4+ cells expressing Foxp3 after 4 days in FACS-sorted naïve CD4+ T cells incubated with CD3/CD28 antibody-coated beads under Treg-inducing conditions. Data are representative of at least 2 independent experiments; error bars denote SEM.
d) MFI of Foxp3 expression in Foxp3+ CD4+ cells from (c). Data are representative of at least 2 independent experiments; error bars denote SEM.
e) Thy1.1 expression in CD4+Foxp3+ splenocytes isolated from bi-cistronic Foxp3Thy1.1 reporter mice treated with AVNM with (+But) or without butyrate as described in Figure 2a legend. Cell surface expression of IRES-driven Thy1.1 reporter inserted into the endogenous Foxp3 locus reflects Foxp3 mRNA levels. The data are representative of at least 3 mice in each group and 2 independent experiments.
f) CD4+Foxp3+ splenocytes from FoxpGFP reporter mice treated with AVNM with or without butyrate (as in Figure 2a) were FACS-sorted and analyzed for Foxp3 mRNA expression by qPCR.
g) AVI-tagged Foxp3-expressing TCli hybridoma cells were treated for 15 h with butyrate at the indicated concentrations followed by immunoprecipitation of tagged Foxp3 protein using streptavidin beads and immunoblotting for acetylated-lysine residues (top panel), total Foxp3 protein (middle panel) and tubulin (bottom panel) from pre-precipitation whole cell lysate. Data are representative of 2 independent experiments.
h) Analysis of suppressor capacity of GFP+ Treg cells sorted from antibiotic-treated (AVNM) Foxp3GFP mice administered (+But) or not administered butyrate in drinking water. Data represent two independent experiments combined with at least 4 mice per group each.
i) FACS-sorted naïve CD4+ T cells isolated from Foxp3GFP animals were incubated with CD3/CD28 antibody-coated beads under Treg-inducing conditions in the presence of indicated amounts of butyrate. Foxp3+ and Foxp3- CD4+ cells were FACS-purified at day 3 of culture and H3K27 acetylation at the Foxp3 promoter and CNS1-3 enhancers was assessed using ChIP-qPCR. Enrichment over input for each indicated Foxp3 regulatory region at given concentrations of butyrate is shown.
Data in this figure are representative of at least 2 independent experiments. The data represent mean +/- SEM. * P ≤ 0.05, ** P ≤ 0.01, *** P ≤ 0.001, **** P ≤ 0.0001, as determined by Student's t-test.

