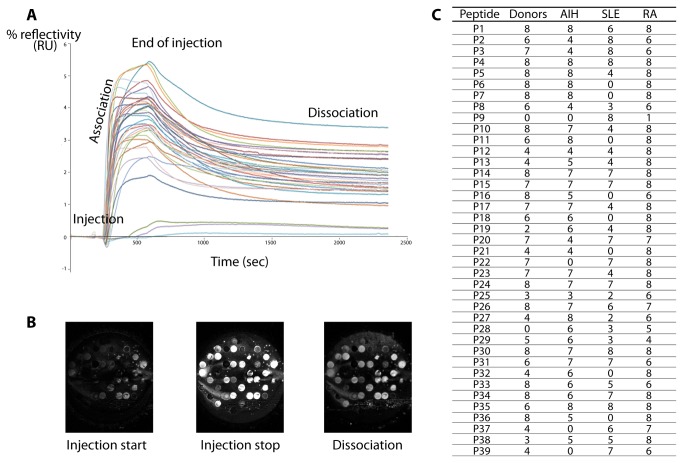
Figure 2. Interactions between peptides and sera.
A. SPRi kinetic curves of serum and peptides immobilized on the surface of a prism. Changes in % reflectivity were measured as a function of time. Each curve shows binding to one of the peptides. B. SPRi difference images of the prism surface at different times. Peptide solutions at 10 mg/mL were spotted on the biochip surface. Difference images show the surface at the start of injection, during the injection and at the stop of injection. C. Number of effective interactions between the 39 peptides covering the sequence of hnRNP B1 and sera from healthy donors, autoimmune hepatitis (AIH), systemic lupus erytheamtosus (SLE), rheumatoid arthritis (RA) patients.

