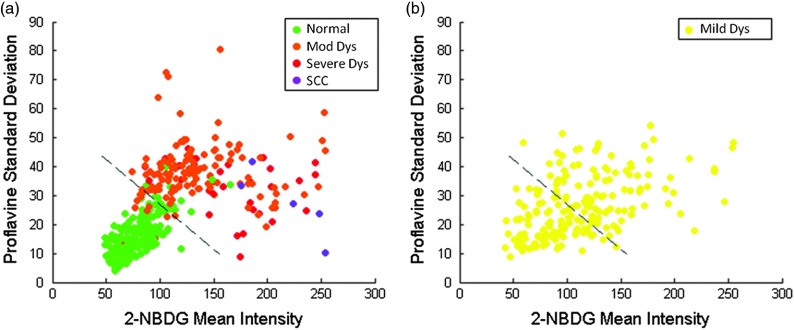
Fig. 6.
Classification of ROIs using proflavine standard deviation and 2-NBDG mean fluorescence intensity. Dashed lines represent the linear threshold values to discriminate normal sites from moderate/severe dysplasia or cancer. Plot of wide-field values of proflavine standard deviation and 2-NBDG mean fluorescence intensity for test regions of interest (ROIs) with a pathology diagnosis of normal, moderate dysplasia, severe dysplasia, and squamous cell carcinoma (a). Plot of values for test set ROIs with a pathology diagnosis of mild dysplasia (b). The color scale in upper right corner shows the histology key.

