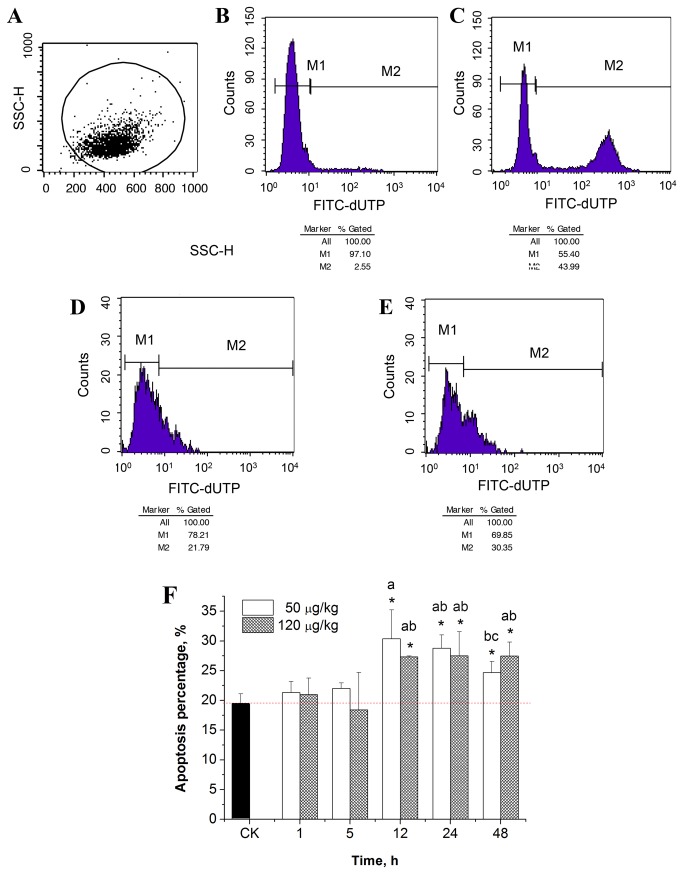
Figure 5. Flow cytometry analysis of liver cell apoptosis.
(A) Flow cytometry analysis of the selected cells; (B) negative control from the TUNEL kit; (C) positive control from the TUNEL kit; (D) cell apoptosis in the control group; (E) 50 μg/kg MC-LR treated group at 12 h; (F) Percentage of apoptotic cells, n = 4. Asterisk indicates the statistical difference relative to the control. M1 represents normal cells vs. the total number of cells, M2 represents the apoptotic cells vs. the total number of cells. Duncan’s test was used to determine the significant difference between groups. The same letter indicates no significant difference between groups, while different letters indicate a significant difference between groups with p < 0.05.

