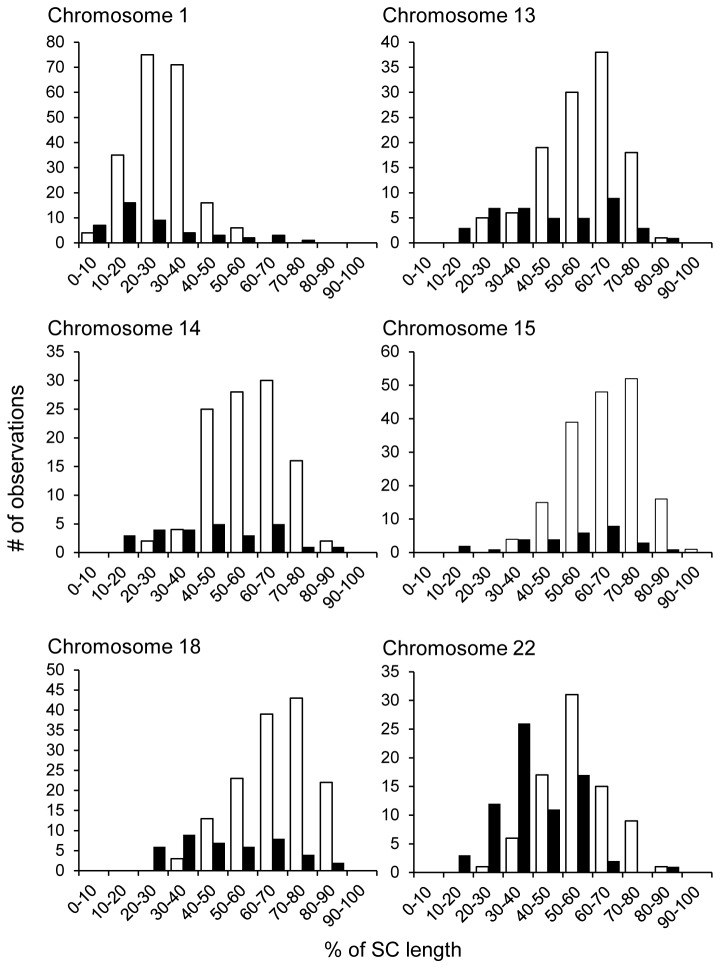
Figure 4. Spacing between adjacent MLH1 foci in males and females.
Inter-focal distances, calculated as the percent of the length of the synaptonemal complex between adjacent MLH1 foci, were determined using the same cells as in Figure 2; male data are depicted in white, female data in black. To obtain sufficient numbers of cells for direct male:female comparisons, we restricted our analysis to chromosomes having the same number of MLH1 foci in males and females; i.e., for chromosome 1 we analyzed cells in which the chromosome exhibited four MLH1 foci and for chromosomes 13, 14, 16, 18 and 22, cells in which the relevant chromosome exhibited two MLH1 foci. Thus, for chromosome 1, we made three measurements of inter-focal distances per cell, while for chromosomes 13, 14, 16, 18 and 22 we made a single measurement of inter-focal distance per cell. For chromosomes 6, 9, 15 and 21 we had a limited number of cells with the same number of MLH1 foci in both sexes; thus, these chromosomes were excluded from the analysis. For each chromosome, inter-focal distances were binned (by % value) into ten groups. The distribution of categories of inter-focal distances was significantly different between males and females for each of the six chromosomes: 1 (χ2=51.7; p<0.0001), 13 (χ2=26.7; p<0.0005), 14 (χ2=30.6; p<0.0001), 16 (χ2=31.9; p<0.0001), 18 (χ2=50.0; p<0.0001), and 22 (χ2=48.8; p<0.0001).

