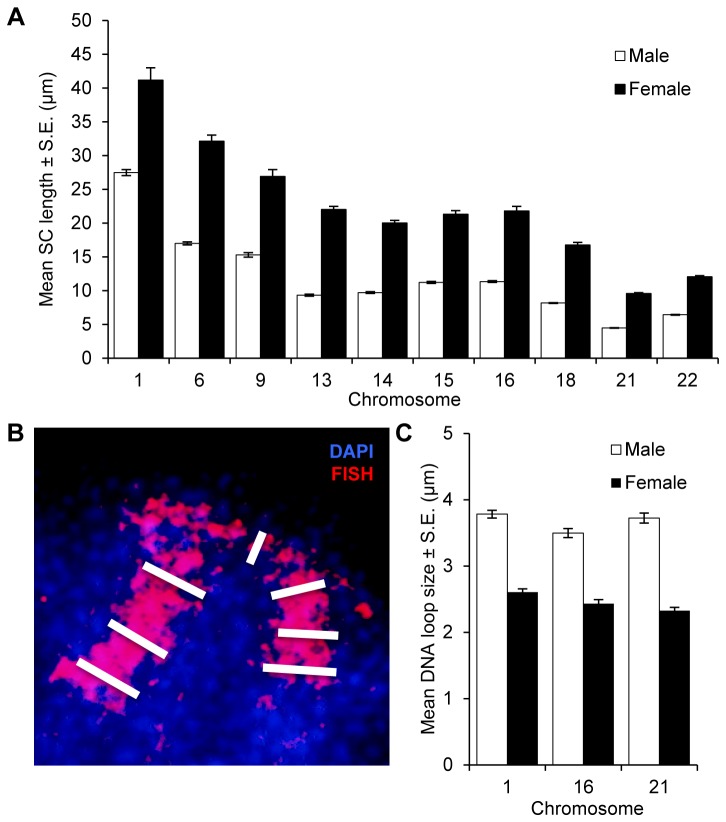
Figure 5. Comparison of SC length and DNA loop size in males and females.
Male data are in white, female data in black. (A) Chromosome-specific SC lengths were determined for cells scored in Figure 2 and striking sex-specific differences were evident on all ten chromosomes analyzed: 1 (t=8.9; p<0.0001), 6 (t=23.1; p<0.0001), 9 (t=12.8; p<0.0001), 13 (t=26.7; p<0.0001), 14 (t=30.8; p<0.0001), 15 (t=24.1; p<0.0001), 16 (t=21.7; p<0.0001), 18 (t=28.6; p<0.0001), 21 (t=36.4; p<0.0001), and 22 (t=35.4; p<0.0001). (B, C) Three individual chromosomes (1, 16 and 21) were analyzed for DNA loop size, using the deflection of FISH paint probes from the SC as a surrogate for loop size. For chromosomes 1 and 16, we measured the width of the FISH signal at the centromere and three points on each chromosome arm, and averaged the seven values. For chromosome 21, loop size was taken as the average of three measurements, one at the centromere and two on the long arm. (B) Blow-up image of a portion of a representative pachytene stage oocyte, labeled with DAPI (blue) and a chromosome 1 paint probe (red). White bars represent the seven individual DNA loop measurements, three from each chromosome arm and one at the centromere. The centromere was identified using CREST prior to FISH. (C) DNA loop size means were significantly greater in males for each chromosome; i.e., for chromosome 1 (2 males, n of cells=24; 3 females, n=23; t=15.2; p<0.0001), for 16 (2 males, n=39; 3 females, n=32; t=20.8; p<0.0001) and for 21 (2 males, n=37; 2 females, n=43; t=16.0; p<0.0001).

