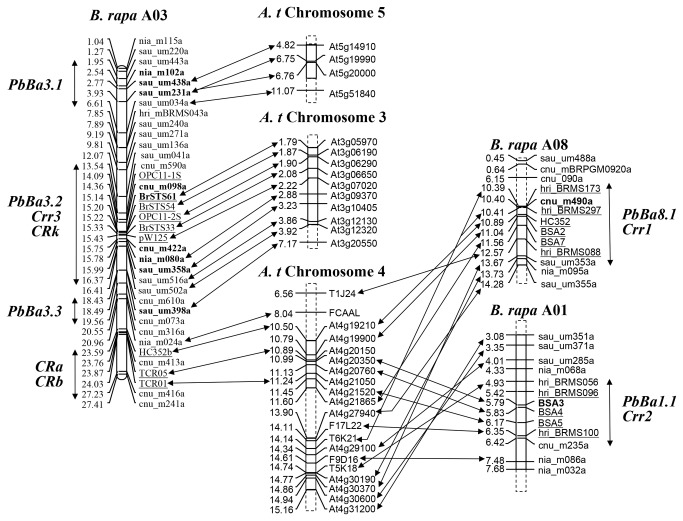
Figure 4. Microsynteny of QTL regions for clubroot resistance between Brassica rapa and Arabidopsis thaliana.
The number on the left of vertical bars indicates the physical position in megabase (Mb) of chromosomes either from B. rapa or Arabidopsis. The clubroot resistance (CR) QTL regions are indicated by vertical lines with 2 arrows. The markers linked to CR QTLs in each linkage map are indicated in boldface. The markers linked to each published CR locus are underlined. The Arabidopsis genes or genomic regions (bacterial artificial chromosome clones) corresponding to the markers on the linkage groups of B. rapa are connected by lines with 2 arrows.

