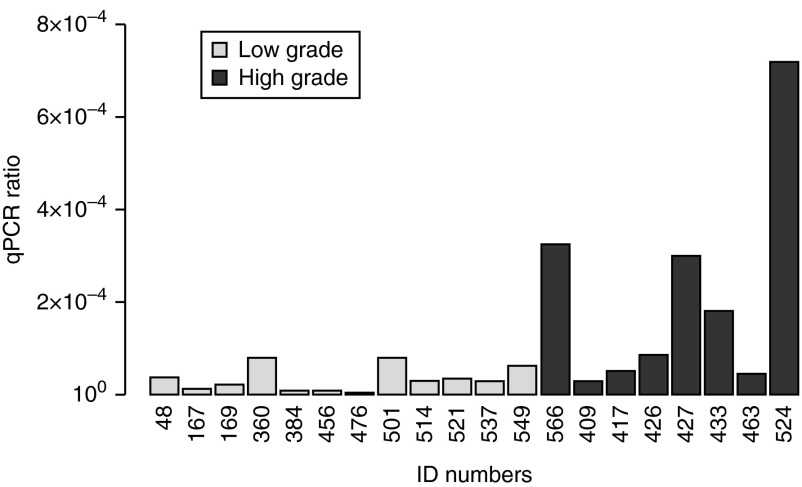
Figure 1.
Expression profile of KAL1 in brain tumor tissues. KAL1 mRNA levels assessed by qRT-PCR in tumor biopsy samples grouped as low and high grade. Expression ratios represent relative quantification normalized to β-actin. The PCR was performed in triplicates and repeated twice. The average of triplicate samples is shown.

 This work is licensed under a