Figure 4.
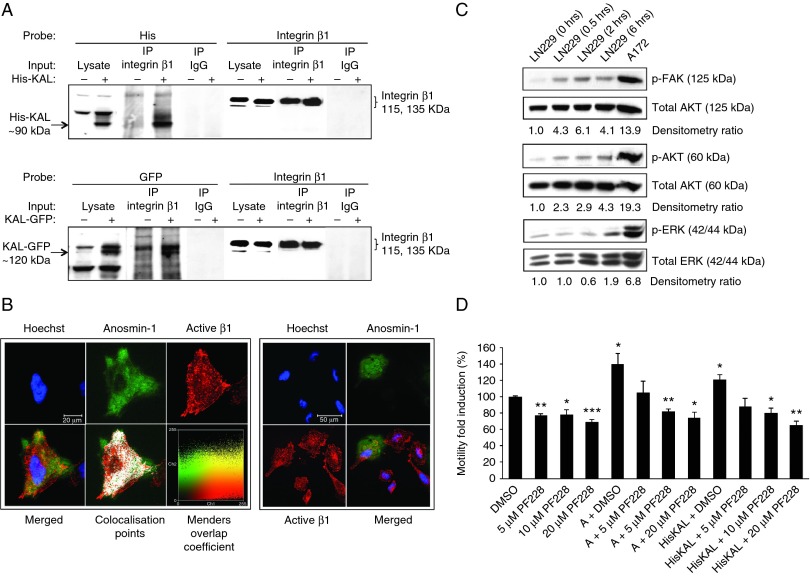
Interaction of anosmin-1 with β1 integrin activates downstream signal pathways. (A) Anosmin-1 co-immunoprecipitated with β1 integrin was identified by probing with anti-His or anti-GFP antibody in LN229 cells transfected with pHis-KAL, pKAL-GFP (+), or empty vector (−). Integrin β1 precipitated by anti-β1 antibody or nonspecific mouse IgG is shown as positive and negative control respectively. (B) Immunofluorescence staining of active integrin β1 (red) in LN229 cells expressing EGFP-tagged anosmin-1 (green). Nuclei were labeled with Hoechst (blue). The colocalization points are also shown (white). A display color-scatter plot is shown of red intensities (Ch1) vs green intensities (Ch2), with the pixels representing the actual color in the image and yellow indicating colocalization. Manders Overlap Coefficient was 0.83, where 1 represents perfect colocalization and 0 represents no colocalization (Manders et al. 1992). On the right panel, an independent image demonstrating anosmin-1 localization at the leading edge of a polarized migrating cell. Scale bar is shown. (C) Induction of p-FAK, p-AKT, and p-ERK upon anosmin-1 treatment in serum-starved LN229 cells at the time points indicated. A172 lysate is included as a positive control for constitutive anosmin-1 expression. The ratio of phosphorylated vs total protein determined by densitometry is shown as fold induction compared with the control. All western blots were repeated twice. (D) Effects of FAK inhibitor (PF-228) on anosmin-1-induced motility. Anosmin-1 significantly increased LN229 cell motility (*P=0.0302 in anosmin-1 recombinant protein treated, and *P=0.0208 in HisKAL-transfected). The pretreatment with increasing concentrations of PF-228, but not with the solvent (DMSO), inhibited the effect of anosmin-1 in a dose-dependent manner. PF-228 alone reduced the basal level motility in LN229, as similarly reported in other cancer cell lines (Slack-Davis et al. 2007). Error bars indicate s.e.m. from four independent experiments (**, P≤0.01; ***, P≤0.001).

 This work is licensed under a