Figure 6.
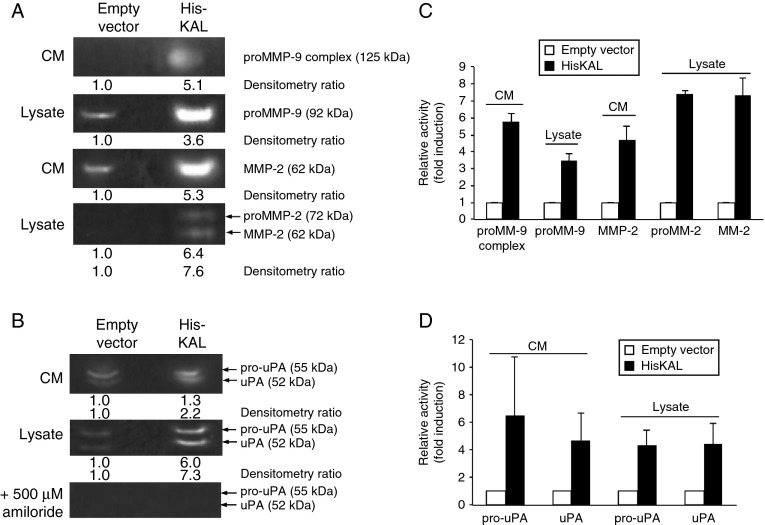
Anosmin-1 induces MMP2/9 and uPA proteolytic activity. Empty vector and pHis-KAL-transfected LN229 were subjected to gelatin zymography to assess MMP2 and MMP9 activities (A) or plasminogen zymography to assess uPA activity (B). Molecular sizes of respective proteins are shown in brackets. The 125 kDa band was previously reported as the heterodimer of proMMP9 with lipocalin (Yan et al. 2001, Rorive et al. 2008). The bands in the plasminogen zymography were inhibited by amiloride treatment, confirming the specificity of the assay. Each lane was loaded with either 40 μl conditioned medium (CM) or 80 μg total cell lysates. The fold inductions of enzyme activity are indicated in relation to the vector transfected cells, as determined by densitometry of the respective bands in inverted images. (C and D) The average fold induction of the relative band intensity is shown as a graph. All experiments were repeated three times. Error bars indicate s.e.m.

 This work is licensed under a