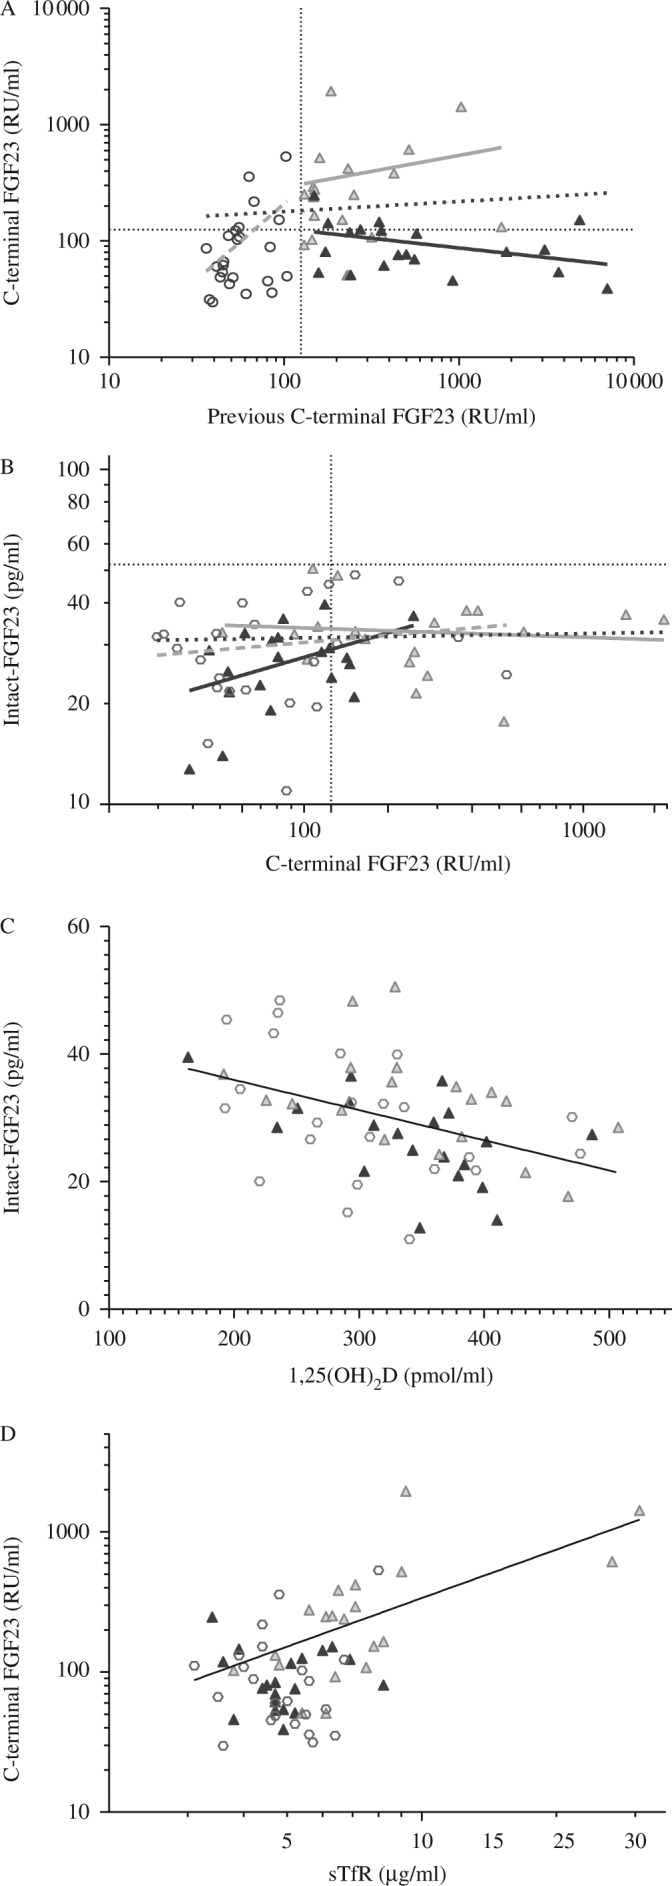
Figure 1.

Scatterplot of C-terminal FGF23 (C-FGF23) concentrations at baseline and follow-up (A); C-FGF23 and intact FGF23 concentrations at follow-up (B);1,25(OH)2D and I-FGF23 concentrations (C); and sTfR and C-FGF23 (D) concentrations by group. BD black triangle, history of rickets and a previously measured elevated C-FGF23 concentration; LC+ grey triangle, local controls with a previously measured high C-FGF23 concentration; LC−, local controls with a previously measured normal C-FGF23 concentration. Dotted lines at 125 RU/ml and 52 pg/ml are upper levels of normal for C-terminal and intact-FGF23 concentrations respectively.
Equations of the line:
 |
 |
 |
 |
 |
 |
 |
 |
 |
 |
 |
 |
 |
 |

 This work is licensed under a