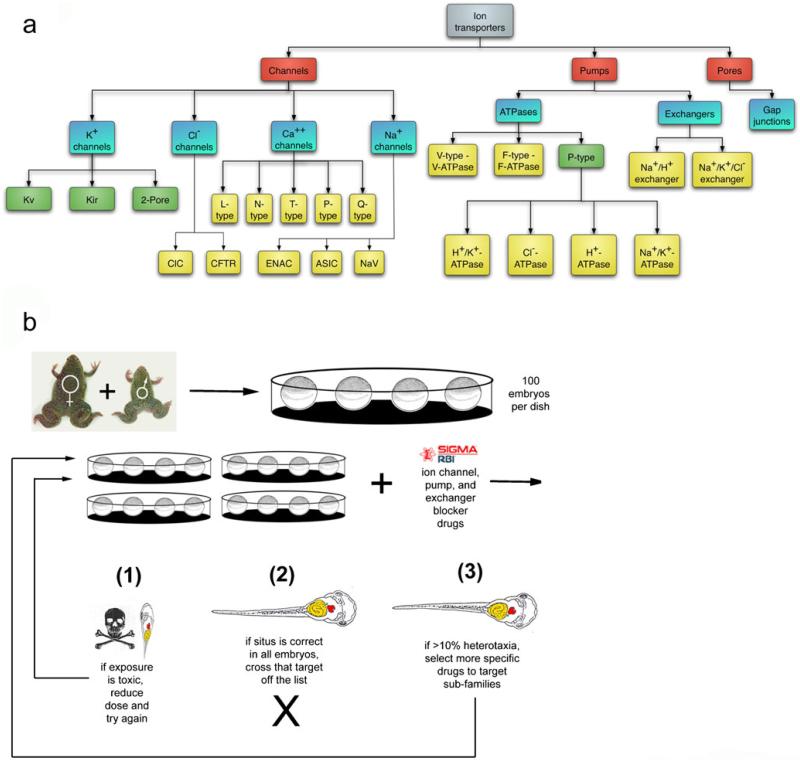
Fig. 4.
Loss-of-function hierarchical drug screens. To determine whether a bioelectric process is likely to be involved in some process of interest and simultaneously to implicate specific channel/pump family(ies) as endogenous mediators of the biophysical signals, a loss-of-function pharmacological screen is performed. Known blockers of different types of channels/pumps are arranged (Adams and Levin 2006a, 2006b) in a hierarchical tree, from least specific to most specific (a). This chemical genetics approach is applied in an assay (b), such as the scoring of asymmetric positioning of internal organs following drug exposure at early embryonic stages (a screen to identify roles for ion flow in a left-right patterning during development; Adams et al. 2006; Levin et al. 2002). A negative result at any node in the tree means that the nodes of drugs (and their matching protein targets) below that point do not have to be pursued further, whereas a positive result (an observable change in the assay outcome) leads to the testing of the nodes below. This screen does not saturate (since not every transporter is blocked by a known drug) and in some (surprisingly rare) cases, pleiotropic functions of a given transporter lead to a toxicity phenotype that precludes a clean yes/no answer. Nevertheless, the existence (and continued development) of a plethora of pharmacological reagents and the demonstrated possibility of dissociating subtle patterning functions of ion flows from housekeeping roles combine to make this a powerful, rapid and inexpensive method to identify a manageable number of candidates for further molecular analysis and to motivate investigations of bioelectric components in a process of interest. Figure in panel a is taken from Adams and Levin 2006a, Fig. 1, with permission of John Wiley and Sons. Figure in panel b is taken from Levin et al. 2006, Fig. 3, with permission of S. Karger AG, Basel

