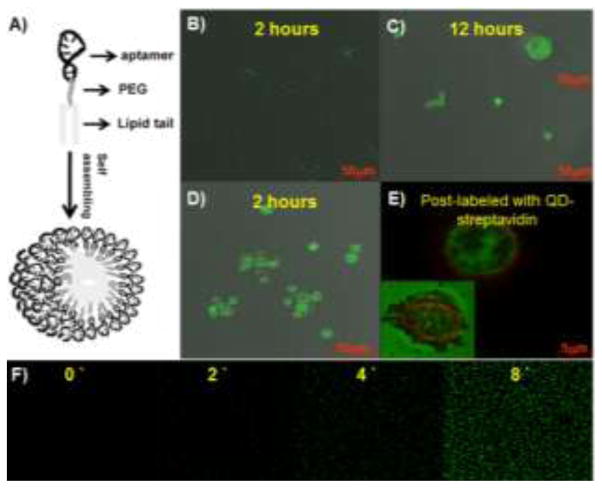
Fig. 6.
Aptamer-micelles for targeted delivery of doped dye. (A) Schematic illustration of aptamer micelle formation. Bright field and fluorescent images of Ramos cells after incubation with free CellTracker Green BODIPY for 2 h (B) and 12 h (C), or incubation with biotin-TD05-micelle doped with CellTracker Green BODIPY for 2 h (D). Image E is the enlarged fluorescent image after postlabeling the biotinylated TD05 aptamer with QD705 streptavidin. The inset in image C is the enlarged individual cell image. The inset in image E is the fluorescent image of the dead cell. (F) Real-time monitoring of doped CellTracker™ released from the core of the micelles. The numbers indicated the time (minutes) of incubation at room temperature. Adapted from ref.78

