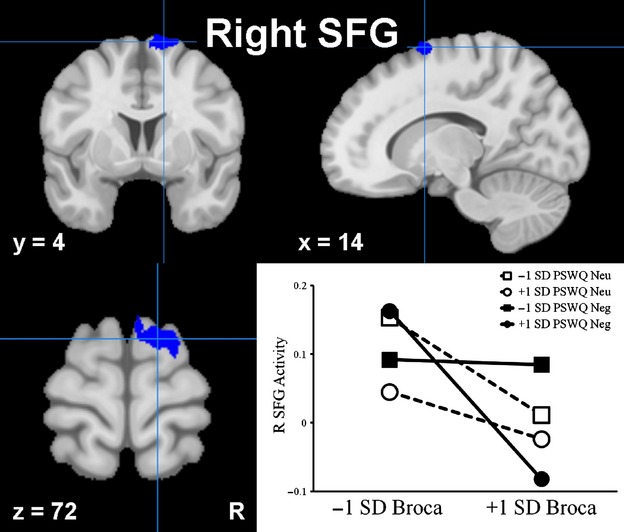
Figure 3.

Moderation of connectivity between Broca's area and right superior frontal gyrus by anxious apprehension. SFG, superior frontal gyrus; Blue, high PSWQ associated with decreased connectivity with Broca's area; Neg, negative condition; Neu, neutral condition. The graph depicts connectivity between Broca's area and right superior frontal gyrus during the negative (solid lines) and neutral (dotted line) conditions at +1 (circle endpoints) and −1 (square endpoints) standard deviations (SD) of the Penn State Worry Questionnaire (PSWQ). Graph reflects values with (normalized) covariates partialled out.
