Fig. 7.

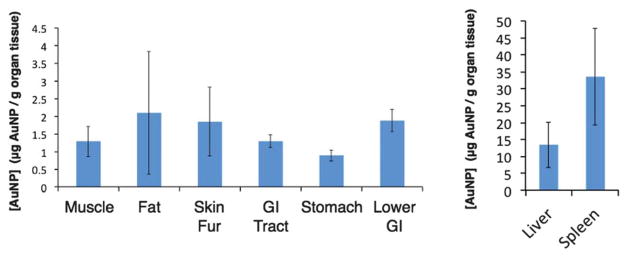
Concentration of compound 4 in various tissues at 24 h. The graph on the right shows the concentration of compound 4 in the liver and spleen on a different scale.

Concentration of compound 4 in various tissues at 24 h. The graph on the right shows the concentration of compound 4 in the liver and spleen on a different scale.