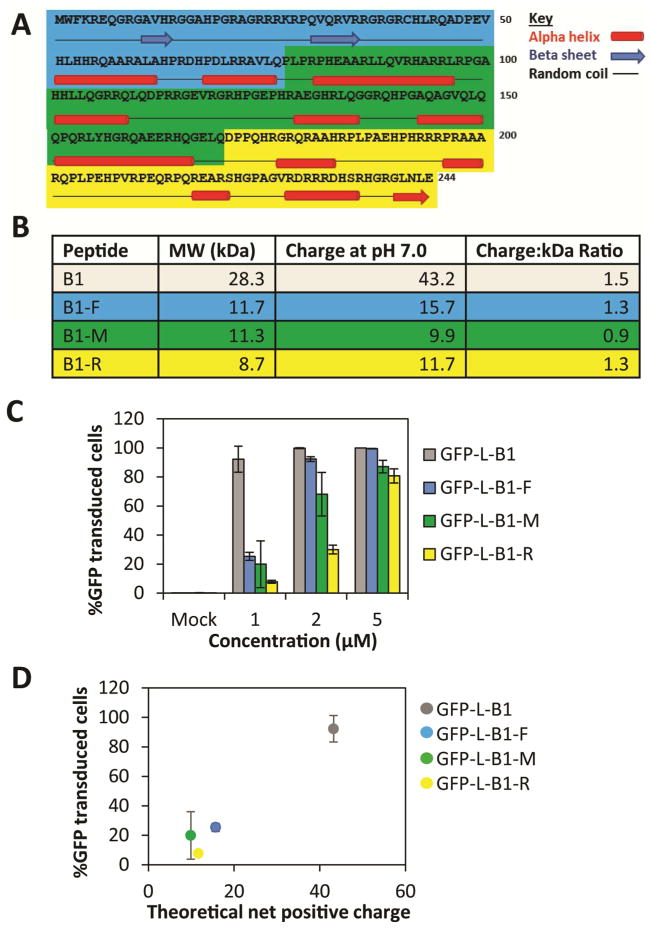
Figure 3. Abbreviated forms of B1 transduce cells, but not as potently as full-length B1.
(A) B1 protein sequence with secondary structure predicted by the GOR4 algorithm (57). B1-F (blue), B1-M (green), B1-R (yellow). (B) Table showing the molecular weight and the predicted charge of truncated B1. (C) TZM-bl cells were exposed to the indicated GFP-fusions for 4 hours at 37°C/5% CO2 prior to quenching with 0.04% Trypan Blue, trypsin digestion and flow cytometric analysis. (D) A plot of % GFP-transduced cells vs. theoretical net positive charge. Error bars represent the standard deviation of two independent experiments.

