Figure 3.
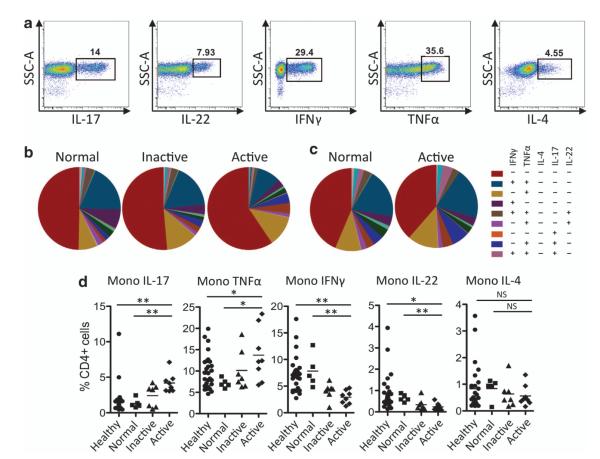
Poly- and mono-cytokine producing CD4+ cells analyzed by boolean gate analysis from the regions of the large intestine of ulcerative colitis (UC) and Crohn’s disease (CD) patients that are normal, with inactive colitis, or active colitis. (a) Representative boolean gating strategy for interleukin (IL)-17, IL-22, interferon-γ (IFNγ), tumor necrosis factor-α (TNFα), and IL-4 in CD4+ lamina propria mononuclear cells (LPMCs) of a UC patient. (b) Pie charts showing the averaged pattern of cytokine production in CD4+ cells from the regions with normal, inactive, and active inflammation of UC patients. Each slice within the pie chart represents a specific combination of cytokine staining. (c) Pie charts showing the averaged pattern of cytokine production in CD4+ cells from the regions with normal and active inflammation of CD patients. Each slice within the pie chart represents a specific combination of cytokine staining. (d) Scatter plots summarizing the percentages of CD4+ cells that are only producing one cytokine (Mono IL-17, IL-22, IFNγ, TNFα, and IL-4) from LPMCs of healthy subjects and UC patients isolated from the regions with normal, inactive, or active colitis. *P<0.05; **P<0.005. NS, not significant; SSC, side scatter.

